Class 6 Exam  >  Class 6 Tests  >  Mathematics (Maths) Class 6  >  Test: Data Handling and Presentation - 2 - Class 6 MCQ

Test: Data Handling and Presentation - 2 - Class 6 MCQ


Test Description

10 Questions MCQ Test Mathematics (Maths) Class 6 - Test: Data Handling and Presentation - 2

Test: Data Handling and Presentation - 2 for Class 6 2024 is part of Mathematics (Maths) Class 6 preparation. The Test: Data Handling and Presentation - 2 questions and answers have been prepared according to the Class 6 exam syllabus.The Test: Data Handling and Presentation - 2 MCQs are made for Class 6 2024 Exam. Find important definitions, questions, notes, meanings, examples, exercises, MCQs and online tests for Test: Data Handling and Presentation - 2 below.
Solutions of Test: Data Handling and Presentation - 2 questions in English are available as part of our Mathematics (Maths) Class 6 for Class 6 & Test: Data Handling and Presentation - 2 solutions in Hindi for Mathematics (Maths) Class 6 course. Download more important topics, notes, lectures and mock test series for Class 6 Exam by signing up for free. Attempt Test: Data Handling and Presentation - 2 | 10 questions in 10 minutes | Mock test for Class 6 preparation | Free important questions MCQ to study Mathematics (Maths) Class 6 for Class 6 Exam | Download free PDF with solutions
Test: Data Handling and Presentation - 2 - Question 1

What does the width of a bar in a bar graph represent?

Detailed Solution for Test: Data Handling and Presentation - 2 - Question 1

Each bar in a bar graph is used to represent a specific category, and the height of the bar shows how much of that category is present (the frequency or value). The width of the bar is generally constant and is used to distinguish between different categories.

Thus, the correct answer is A: The category of data.

Test: Data Handling and Presentation - 2 - Question 2

Directions For Questions: The following pictograph shows the number of scooters sold by a company during a week. Study the pictograph carefully and answer the questions given below.
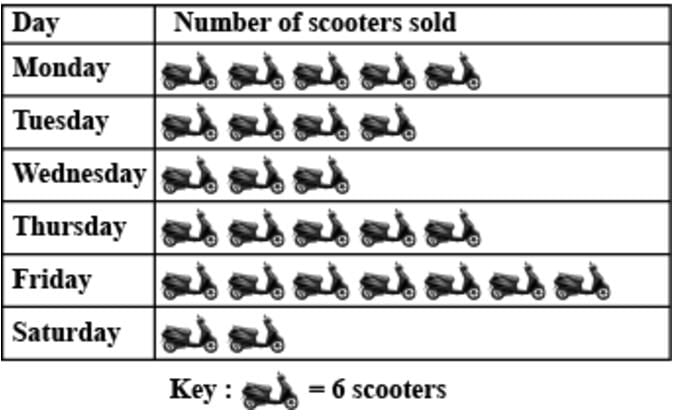
On which day of the week was the sale of the scooters was maximum?

Detailed Solution for Test: Data Handling and Presentation - 2 - Question 2

Given: One scooter = 6 scooters

So total sold scooters = (Number of scooters) × 6

  • Monday = 5 × 6 = 30
  • Tuesday = 4 × 6 = 24
  • Wednesday = 3 × 6 = 18
  • Thursday = 5 × 6 = 30
  • Friday = 7 × 6 = 42
  • Saturday = 2 × 6 = 12

Hence, maximum scooters were sold on Friday.

Answer: B

1 Crore+ students have signed up on EduRev. Have you? Download the App
Test: Data Handling and Presentation - 2 - Question 3

If you need to represent data on the number of pets owned by students in different grades, which type of graph is most suitable?

Detailed Solution for Test: Data Handling and Presentation - 2 - Question 3

To represent data on the number of pets owned by students in different grades, the most suitable type of graph would be a Bar Graph.

Here's why: A Bar Graph is ideal for comparing quantities across different categories, like the number of pets owned by students in each grade. Each grade can be represented as a category on the x-axis, and the number of pets can be represented on the y-axis.

Thus, the correct answer is B: Bar Graph.

Test: Data Handling and Presentation - 2 - Question 4

Representation of data in tabular form is done by using _______ .

Detailed Solution for Test: Data Handling and Presentation - 2 - Question 4

To answer the question "Representation of data in tabular form is done by using _______", we can follow these steps:

Understanding the Question: The question asks for the method used to represent data in a tabular format. We need to identify the correct term from the options provided.

Analyzing Each Option:
Bar graph: This is a graphical representation of data, not specifically a tabular form.
Frequency: This refers to the number of times a particular value occurs, but it is not a method of representation itself.
Tally marks: This is a method used to count and represent data in a simple and organized way, often used in tables.
None of these: This option implies that none of the above methods are correct.

Identifying the Correct Answer: Since tally marks are commonly used to represent data in a tabular format, we conclude that the correct answer is tally marks.

Representation of data in tabular form is done by using tally marks.

Test: Data Handling and Presentation - 2 - Question 5

In the data 18, 13, 15, 13, 18, 14, 15, 13, 14, 15, how many times the number '15' repeats itself?

Detailed Solution for Test: Data Handling and Presentation - 2 - Question 5

The number '15' repeats 3 times in the given data: 18, 13, 15, 13, 18, 14, 15, 13, 14, 15.

So, the correct answer is: C: 3

Test: Data Handling and Presentation - 2 - Question 6

Read the given bar graph and answer the question given below

Which month maximum rainfall?

Detailed Solution for Test: Data Handling and Presentation - 2 - Question 6

The month with the maximum rainfall is August, which has the tallest bar.
Thus, the correct answer is: B: August.

Test: Data Handling and Presentation - 2 - Question 7

The frequency of 2 in the data 1, 1, 2, 2, 3, 3, 4, 4, 2, 2, 3, is ______ .

Detailed Solution for Test: Data Handling and Presentation - 2 - Question 7

In the given data: 1, 1, 2, 2, 3, 3, 4, 4, 2, 2, 3

The number 2 appears 4 times.

So, the frequency of 2 is: 4

Test: Data Handling and Presentation - 2 - Question 8

If the range of a data set is 15 and the smallest value is 5, what is the largest value?

Detailed Solution for Test: Data Handling and Presentation - 2 - Question 8

Given the following information:

  • The range of the data set is 15.
  • The smallest value is 5.

The formula for range is:

Range = Largest value - Smallest value

Substituting the known values into the formula:

15 = Largest value - 5

Solving for the largest value:

Largest value = 15 + 5 = 20

The largest value in the data set is 20.

Test: Data Handling and Presentation - 2 - Question 9

The given graph shows the marks scored by a student in his class test. Read the graph shown and answer the questions:

Highest marks are scored in ______ .

Detailed Solution for Test: Data Handling and Presentation - 2 - Question 9

Marks in English (from graph) = 15
Marks in Hindi (from graph) = 10
Marks in Maths (from graph) = 30
Marks in Science (from graph) = 20
Marks in S.St (from graph) = 25

Highest Mark are scored in Maths (30)

Test: Data Handling and Presentation - 2 - Question 10

If  represents 5 eggs how many eggs does represent?

Detailed Solution for Test: Data Handling and Presentation - 2 - Question 10

If  represents 5 eggs, then represents 4 times 5 eggs.

So, = 4 × 5 = 20 eggs.

The correct answer is: C) 20

92 videos|348 docs|54 tests
Information about Test: Data Handling and Presentation - 2 Page
In this test you can find the Exam questions for Test: Data Handling and Presentation - 2 solved & explained in the simplest way possible. Besides giving Questions and answers for Test: Data Handling and Presentation - 2, EduRev gives you an ample number of Online tests for practice

Top Courses for Class 6

92 videos|348 docs|54 tests
Download as PDF

Top Courses for Class 6