Bank Exams Exam  >  Bank Exams Tests  >  SBI PO Prelims & Mains Preparation  >  Test: Bar Graph - Bank Exams MCQ

Test: Bar Graph - Bank Exams MCQ


Test Description

10 Questions MCQ Test SBI PO Prelims & Mains Preparation - Test: Bar Graph

Test: Bar Graph for Bank Exams 2024 is part of SBI PO Prelims & Mains Preparation preparation. The Test: Bar Graph questions and answers have been prepared according to the Bank Exams exam syllabus.The Test: Bar Graph MCQs are made for Bank Exams 2024 Exam. Find important definitions, questions, notes, meanings, examples, exercises, MCQs and online tests for Test: Bar Graph below.
Solutions of Test: Bar Graph questions in English are available as part of our SBI PO Prelims & Mains Preparation for Bank Exams & Test: Bar Graph solutions in Hindi for SBI PO Prelims & Mains Preparation course. Download more important topics, notes, lectures and mock test series for Bank Exams Exam by signing up for free. Attempt Test: Bar Graph | 10 questions in 10 minutes | Mock test for Bank Exams preparation | Free important questions MCQ to study SBI PO Prelims & Mains Preparation for Bank Exams Exam | Download free PDF with solutions
Test: Bar Graph - Question 1

Study the following bar chart carefully and answer the given question.

Data regarding the number of people who were tested positive with COVID-19 during January, February and March in five countries is given in the stack bar chart.

Data of number of People in five countries who were found positive with COVID-19 test
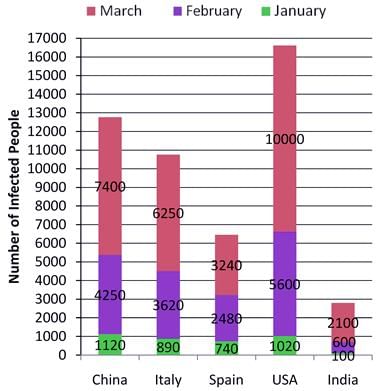
Q. Which countries in February showed more than 3000 positive tests?

Detailed Solution for Test: Bar Graph - Question 1

We can see that China, Italy and the USA showed more than 3000 positive tests.

Test: Bar Graph - Question 2

Study the following bar chart carefully and answer the given question.

Data regarding the number of people who were tested positive with COVID-19 during January, February and March in five countries is given in the stack bar chart.

Data of number of People in five countries who were found positive with COVID-19 test
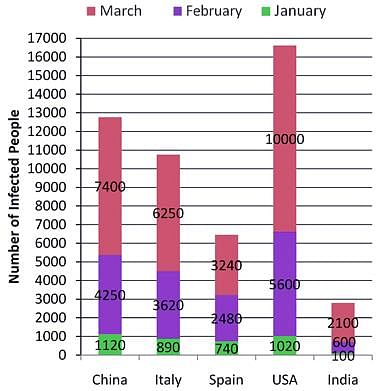
Q. Japan in January had twice the number of cases that India had in January while 50% more cases in February than India that India had in February. Find the number of cases in Japan in March if cases in March were twice the total cases till February end.

Detailed Solution for Test: Bar Graph - Question 2

Number of cases in India in January = 100
 
Number of cases in Japan in January =  2 × 100 = 200
 
Number of cases in February in India = 600
 
Number of cases in Japan in February = 600 + 50% of 600 = 900
 
Total cases in Japan till Feb end = 200 + 900 = 1100
 
Number of cases in March = 2 × 1100 = 2200
 
Hence, option C is correct.

1 Crore+ students have signed up on EduRev. Have you? Download the App
Test: Bar Graph - Question 3

Study the following bar chart carefully and answer the given question.

Data regarding the number of people who were tested positive with COVID-19 during January, February and March in five countries is given in the stack bar chart.

Data of number of People in five countries who were found positive with COVID-19 test
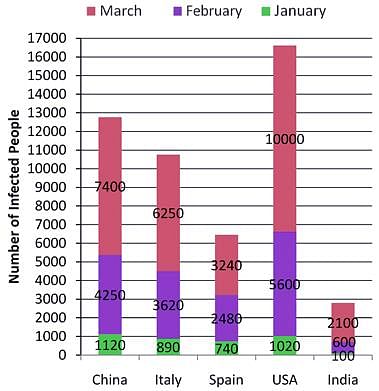
Q. Find the average number of people per day who were tested positive in India in March. 

Detailed Solution for Test: Bar Graph - Question 3

Number of people tested positive in March  = 2100.

Number of days in March = 31

Hence, option B is correct.

Test: Bar Graph - Question 4

Directions: Read the following information carefully and answer the questions based on it.

Following bar graph shows number of students of different branches of a college. Study the graph and answer the following question.
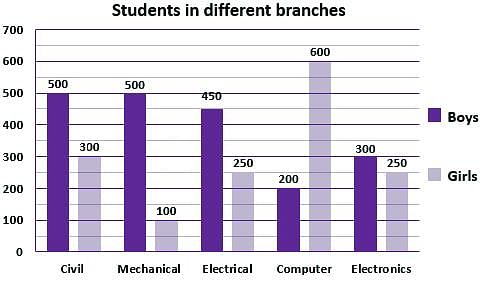
Q. Which branch has minimum ratio of boys’ and girls’ students?

Detailed Solution for Test: Bar Graph - Question 4

Given,

Civil branch = 500 : 300 = 5 : 3 = 1.66

Mechanical branch = 500 : 100 = 5 : 1 = 5

Electrical branch = 450 : 250 = 9 : 5 = 1.8

Computer branch = 200 : 600 = 1 : 3 = 0.33

Electronics branch = 300 : 250 = 6 : 5 = 1.2

From this,

Computer branch has minimum ratio of boys and girls students in College.

Test: Bar Graph - Question 5

Directions: Read the following information carefully and answer the questions based on it.

Following bar graph shows number of students of different branches of a college. Study the graph and answer the following question.
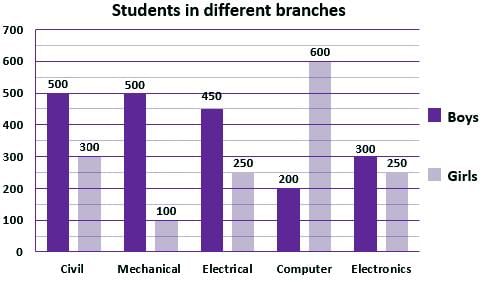
Q. Ratio of total number of students in computer branch to total number of Students of Mechanical and Electronics is -

Detailed Solution for Test: Bar Graph - Question 5

Total number of students in Computer branch

= 200 + 600

= 800

Total number of students in Mechanical and Electronics branch

= (500 + 100) + (300 + 250)

= 1150

Required ratio

= 800 : 1150

= 32 : 46

= 16 : 23

Test: Bar Graph - Question 6

Directions: Read the following information carefully and answer the questions based on it.

Following bar graph shows number of students of different branches of a college. Study the graph and answer the following question.
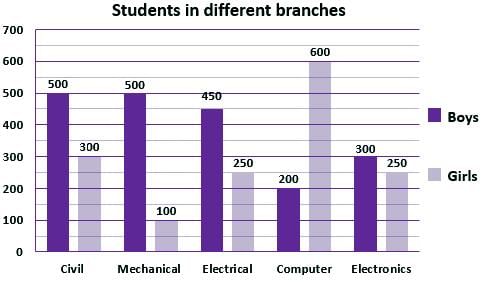
Q. Find the average number of boys in a college including five branches.

Detailed Solution for Test: Bar Graph - Question 6

Given,

Total number of boys including those from the five branches

= 500 + 500 + 450 + 200 + 300

= 1950

Required average

= 1950/5

= 390

Test: Bar Graph - Question 7

Directions : Study the following bar chart carefully and answer the given questions.

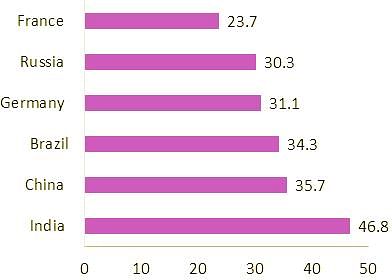
The following graph gives the information of milk production (in billion litres) in 6 different countries of the world.
 
(Assume that there are only six countries in the world which produce milk)
1 billion = 100 crore = 10000 lakhs 
Global Milk Production (2017)
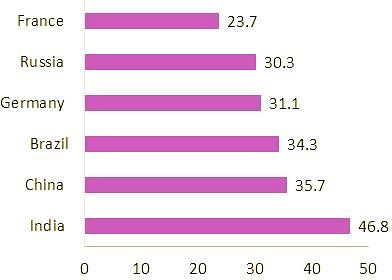
Q. What percentage of the total milk production in the world in 2017 is contributed by India’s total milk production in that year?

Detailed Solution for Test: Bar Graph - Question 7

The total quantity of milk produced in the world in the year 2017 = 46.8 + 35.7 + 34.3 + 31.1 + 30.3 + 23.7 = 201.9 billion litres

The total quantity of milk produced in India in that year = 46.8 billion litres

Hence, option B is correct.

Test: Bar Graph - Question 8

Directions : Study the following bar chart carefully and answer the given questions.

The following graph gives the information of milk production (in billion litres) in 6 different countries of the world.
 
(Assume that there are only six countries in the world which produce milk)
1 billion = 100 crore = 10000 lakhs 
Global Milk Production (2017)
Q. Find the maximum difference between the quantity of milk produced by any two countries?

Detailed Solution for Test: Bar Graph - Question 8

From the chart, it is clear that the maximum difference will be the difference between the quantity of milk produced by India and that of France = 46.8 – 23.7 = 23.1 billion litres   

Test: Bar Graph - Question 9

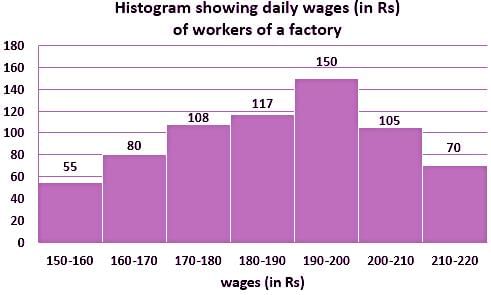
The given histogram shows the daily wages ( in Rs.) of workers in a factory.

study the histogram and answer the question that follows.
Q. The number of workers with daily wages less than Rs. 180 is what percentage of the number of workers with daily wages more than Rs. 190? Express your answer correct to one decimal place.

Detailed Solution for Test: Bar Graph - Question 9

Given:

There is the histogram shows the daily wages ( in Rs.) of workers in a factory.

Calculation:

The number of workers with daily wages less than Rs. 180 = 55 + 80 + 108 = 243

The number of workers with daily wages is more than Rs. 190 = 150 + 105 + 70 = 325

The percentage = (243/325) × 100 = 74.76...% ≈ 74.8%

∴ The number of workers with daily wages less than Rs. 180 is 74.8% of the number of workers with daily wages more than Rs. 190

Test: Bar Graph - Question 10

Direction : Study the following bar chart carefully and answer the given question.
 
The bar chart given below shows the number of students who cleared the two examinations, RRB Scale 1 and RRB Assistant over the years per every 1000 students who appeared in these exams. 
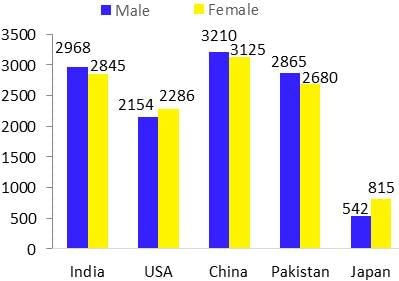
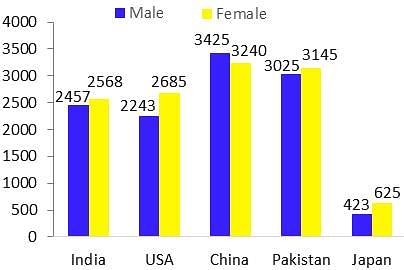
Q. In how many countries was the number of deaths in 2016 less than that in 2017?


Detailed Solution for Test: Bar Graph - Question 10

In 2016,

Number of deaths in India = 2968 + 2845 = 5813

Number of deaths in USA = 2154 + 2286 = 4440

Number of deaths in China = 3210 + 3125 = 6335

Number of deaths in Pakistan = 2865 + 2860 = 5725

Number of deaths in Japan = 542 + 815 = 1357

In 2017, 

Number of deaths in India = 2457 + 2568 = 5025

Number of deaths in USA = 2243 + 2685 = 4928

Number of deaths in China = 3425 + 3240 = 6665

Number of deaths in Pakistan = 3025 + 3145 = 6170

Number of deaths in Japan = 423 + 625 = 1048

Required answer = USA, China, Pakistan 

Hence, option C is correct.

628 videos|824 docs|280 tests
Information about Test: Bar Graph Page
In this test you can find the Exam questions for Test: Bar Graph solved & explained in the simplest way possible. Besides giving Questions and answers for Test: Bar Graph, EduRev gives you an ample number of Online tests for practice

Top Courses for Bank Exams

628 videos|824 docs|280 tests
Download as PDF

Top Courses for Bank Exams