CAT Exam  >  CAT Tests  >  Logical Reasoning (LR) and Data Interpretation (DI)  >  Test: Venn Diagrams- 2 - CAT MCQ

Test: Venn Diagrams- 2 - CAT MCQ


Test Description

10 Questions MCQ Test Logical Reasoning (LR) and Data Interpretation (DI) - Test: Venn Diagrams- 2

Test: Venn Diagrams- 2 for CAT 2024 is part of Logical Reasoning (LR) and Data Interpretation (DI) preparation. The Test: Venn Diagrams- 2 questions and answers have been prepared according to the CAT exam syllabus.The Test: Venn Diagrams- 2 MCQs are made for CAT 2024 Exam. Find important definitions, questions, notes, meanings, examples, exercises, MCQs and online tests for Test: Venn Diagrams- 2 below.
Solutions of Test: Venn Diagrams- 2 questions in English are available as part of our Logical Reasoning (LR) and Data Interpretation (DI) for CAT & Test: Venn Diagrams- 2 solutions in Hindi for Logical Reasoning (LR) and Data Interpretation (DI) course. Download more important topics, notes, lectures and mock test series for CAT Exam by signing up for free. Attempt Test: Venn Diagrams- 2 | 10 questions in 20 minutes | Mock test for CAT preparation | Free important questions MCQ to study Logical Reasoning (LR) and Data Interpretation (DI) for CAT Exam | Download free PDF with solutions
Test: Venn Diagrams- 2 - Question 1

Shyam visited Ram during his brief vacation. In the mornings they both would go for yoga. In the evenings they would play tennis. To have more fun, they indulge only in one activity per day, i.e. either they went for yoga or played tennis each day. There were days when they were lazy and stayed home all day long. There were 24 mornings when they did nothing, 14 evenings when they stayed at home, and a total of 22 days when they did yoga or played tennis. For how many days Shyam stayed with Ram?

Detailed Solution for Test: Venn Diagrams- 2 - Question 1

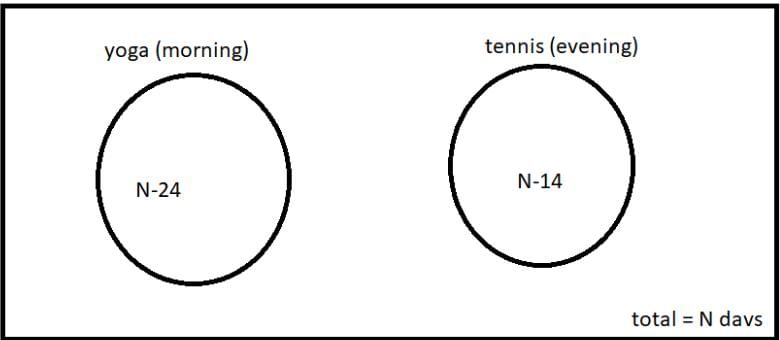
Let the number of total days=N
They played tennis for=N-14  days
They did yoga for =N-24 days

And the question says that total days when they did yoga or played tennis are 22

which means

N-14 + N-24 = 22

2N – 38 = 22

2N = 60

N = 30

Hence total days they stayed together were 30

Test: Venn Diagrams- 2 - Question 2

How many schools had none of the three viz., laboratory, library or play – ground?

Detailed Solution for Test: Venn Diagrams- 2 - Question 2


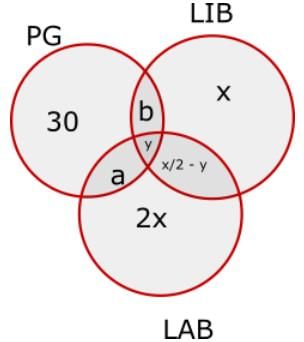
The diagram for this question has been shown:

Total number of schools having either or LAB or LIB or both = a+b+x/2 – y + y + 3x = 7x/2 + a + b = 35

Here a = b = y = 0

7x/2 = 35

x = 10

Total number of schools having at least one of PG, LIB or LAB = 30+2x+x+x/2 = 30+3x+x/2 = 30+30+5 = 65

Number of schools having neither of the three = 100-65 = 35

1 Crore+ students have signed up on EduRev. Have you? Download the App
Test: Venn Diagrams- 2 - Question 3

What was the ratio of schools having laboratory those having library?

Detailed Solution for Test: Venn Diagrams- 2 - Question 3


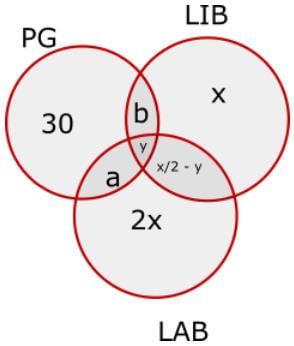
The diagram for this question has been shown:

Total number of schools having either or LAB or LIB or both = a+b+x/2 – y + y + 3x = 7x/2 + a + b = 35

It has been given that the schools having playground don’t have a Library or Laboratory.

Hence  a = b = y = 0

7x/2 = 35

x = 10

Required ratio = 25:15 = 5:3

Test: Venn Diagrams- 2 - Question 4

A survey of 200 people in a community who watched at least one of the three channels — BBC, CNN and DD — showed that 80% of the people watched DD, 22% watched BBC, and 15% watched CNN.

What is the maximum percentage of people who can watch all the three channels?

Detailed Solution for Test: Venn Diagrams- 2 - Question 4

Let a be the number who watch only one channel, b be the number who watch only 2 channels and c be the number who watch all channels.

a+b+c = 100

a+2b+3c = 80+22+15  =117

Subtracting both equations,

b+2c = 117-100 = 17

Maximum c occurs when b = 0

2c = 17

c = 8.5

Test: Venn Diagrams- 2 - Question 5

A survey of 200 people in a community who watched at least one of the three channels — BBC, CNN and DD — showed that 80% of the people watched DD, 22% watched BBC, and 15% watched CNN.

If 5% of people watched DD and CNN, 10% watched DD and BBC, then what percentage of people watched BBC and CNN only?

Detailed Solution for Test: Venn Diagrams- 2 - Question 5

Applying AUBUC formula

Let x be the number who watch BBC and CNN and y be the number who watch all three channels.

100 = 80+22+15-(10+5+x)+y

x-y = 2

Hence only 2% people watch BBC and CNN only.

Test: Venn Diagrams- 2 - Question 6

A survey of 200 people in a community who watched at least one of the three channels — BBC, CNN and DD — showed that 80% of the people watched DD, 22% watched BBC, and 15% watched CNN.

Referring to the previous question, what percentage of people watched all the three channels?

Detailed Solution for Test: Venn Diagrams- 2 - Question 6

Applying AUBUC formula

Let x be the number who watch BBC and CNN and y be the number who watch all three channels.

100 = 80+22+15-(10+5+x)+y

x-y = 2

We cannot find the exact value of y.

Hence, the answer is “cannot be determined”.

*Answer can only contain numeric values
Test: Venn Diagrams- 2 - Question 7

Each of 74 students in a class studies at least one of the three subjects H, E and P. Ten students study all three subjects, while twenty study H and E, but not P. Every student who studies P also studies H or E or both. If the number of students studying H equals that studying E, then the number of students studying H is


Detailed Solution for Test: Venn Diagrams- 2 - Question 7

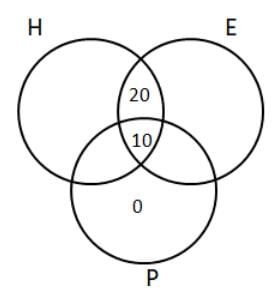
Let us draw a Venn diagram using the information present in the question.

It is given that the number of students studying H equals that studying E.

Let ‘x’ be the total number of students who studied H, and H and P but mot E.We can also say that the same will be the number of students who studied E, and E and P but not H.Therefore,

x + 20 + 10 + x = 74

x = 22

Hence, the number of students studying H = 22 + 10+ 20 = 52

Test: Venn Diagrams- 2 - Question 8

If among 200 students, 105 like pizza and 134 like burger, then the number of students who like only burger can possibly be

Detailed Solution for Test: Venn Diagrams- 2 - Question 8

It has been given that among 200 students, 105 like pizza and 134 like burger.
The question asks us to find out the number of students who can be liking only burgers among the given values.

The least number of students who like only burger will be obtained when everyone who likes pizza likes burger too.
In this case, 105 students will like pizza and burger and 134-105 = 29 students will like only burger. Therefore, the number of students who like only burger cannot be less than 29.

The maximum number of students who like only burger will be obtained when we try to separate the 2 sets as much as possible.
There are 200 students in total. 105 of them like pizza. Therefore, the remaining 95 students can like only burger and 134-95 = 39 students can like both pizza and burger. As we can see, the number of students who like burger cannot exceed 95.

The number of students who like only burger should lie between 29 and 95 (both the values are included).
93 is the only value among the given options that satisfies this condition and hence, option D is the right answer.

*Answer can only contain numeric values
Test: Venn Diagrams- 2 - Question 9

For two sets A and B, let AΔB denote the set of elements which belong to A or B but not both. If P = {1,2,3,4}, Q = {2,3,5,6,}, R = {1,3,7,8,9}, S = {2,4,9,10}, then the number of elements in (PΔQ)Δ(RΔS) is


Detailed Solution for Test: Venn Diagrams- 2 - Question 9

P = {1,2,3,4} and  Q = {2,3,5,6,}
PΔQ = {1, 4, 5, 6}
R = {1,3,7,8,9} and S = {2,4,9,10}
RΔS = {1, 2, 3, 4, 7, 8, 10}
(PΔQ)Δ(RΔS) = {2, 3, 5, 6, 7, 8, 10}
Thus, there are 7 elements in (PΔQ)Δ(RΔS) .
hence, 7 is the correct answer.

Test: Venn Diagrams- 2 - Question 10

If A = {62n - 35n-1}, where n = 1,2,3, ... and B = {35(n-1)}, where n = 1,2,3, ... then which of the following is true?

Detailed Solution for Test: Venn Diagrams- 2 - Question 10

If we carefully observe set A, then we find that 62n - 35n-1 is divisible by 35.

So, set A contains multiples of 35.

However, not all the multiples of 35 are there in set A, for different values of n.

For n = 1, the value is 0, for n = 2, the value is 1225 which is the 35th multiple of 3.

If we observe set B, it consists of all the multiples of 35 including 0.

So, we can say that every member of set A will be in B while every member of set B will not necessarily be in set A.

Hence, option A is the correct answer.

88 videos|119 docs|91 tests
Information about Test: Venn Diagrams- 2 Page
In this test you can find the Exam questions for Test: Venn Diagrams- 2 solved & explained in the simplest way possible. Besides giving Questions and answers for Test: Venn Diagrams- 2, EduRev gives you an ample number of Online tests for practice

Top Courses for CAT

Download as PDF

Top Courses for CAT