MCQ: Line Charts - 2 - SSC CGL MCQ
15 Questions MCQ Test Quantitative Aptitude for SSC CGL - MCQ: Line Charts - 2
Direction: The following line graph gives the annual percent profit earned by a Company during the period 1995 - 2000.
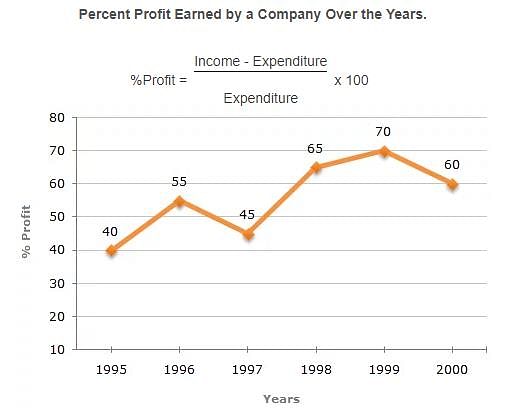
Q. What is the average profit earned for the given years?

Direction: The following line graph gives the annual percent profit earned by a Company during the period 1995 - 2000.
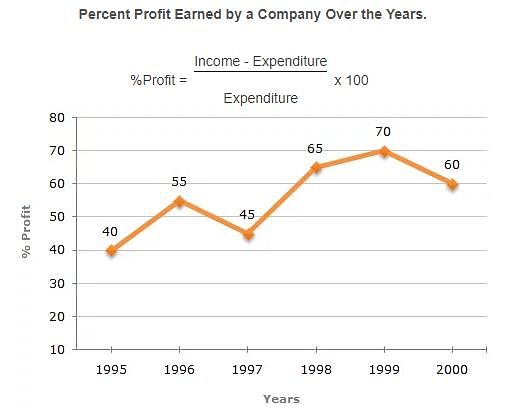
Q. In which year is the expenditure minimum?

| 1 Crore+ students have signed up on EduRev. Have you? Download the App |
Direction: The following line graph gives the annual percent profit earned by a Company during the period 1995 - 2000.
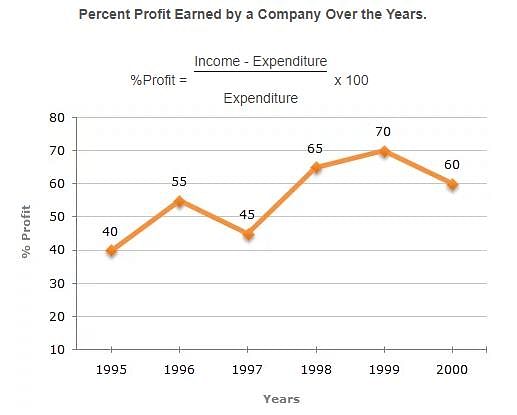
Q. If the profit in 1999 was ₹ 4 crores, what was the profit in 2000?

Direction: The following line graph gives the annual percent profit earned by a Company during the period 1995 - 2000.
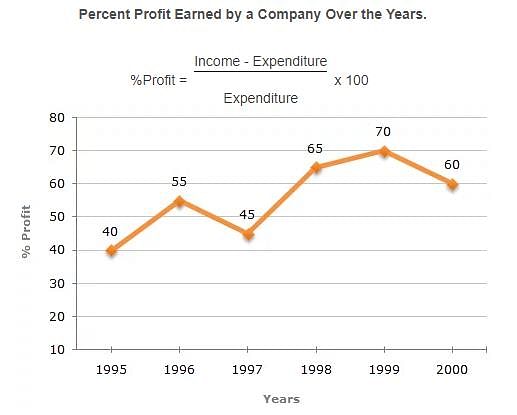
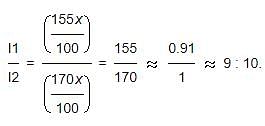
Q. If the expenditures in 1996 and 1999 are equal, then the approximate ratio of the income in 1996 and 1999 respectively is?
Direction: The following line graph gives the annual percent profit earned by a Company during the period 1995 - 2000.
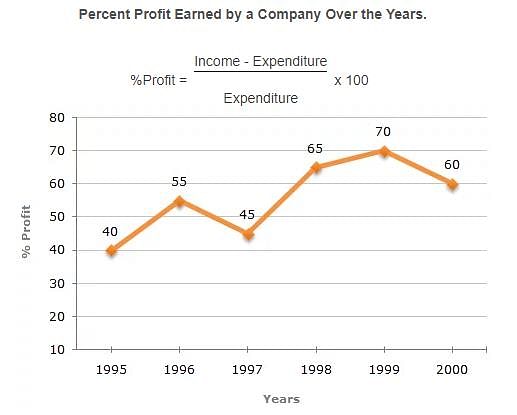
Q. If the income in 1998 was ₹ 264 crores, what was the expenditure in 1998?
Direction: The following line graph gives the percentage of the number of candidates who qualified an examination out of the total number of candidates who appeared for the examination over a period of seven years from 1994 to 2000.
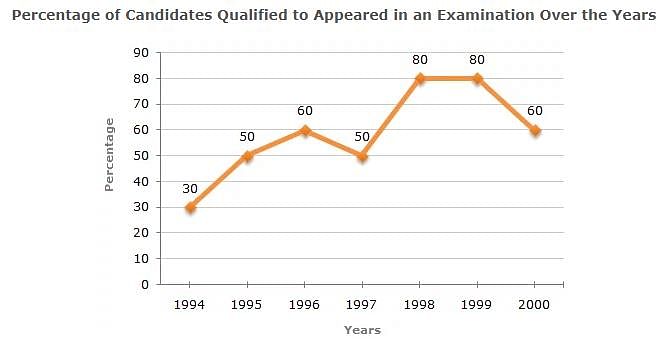
Q. The difference between the percentage of candidates qualified to appeared was maximum in which of the following pairs of years?
Direction: The following line graph gives the percentage of the number of candidates who qualified an examination out of the total number of candidates who appeared for the examination over a period of seven years from 1994 to 2000.
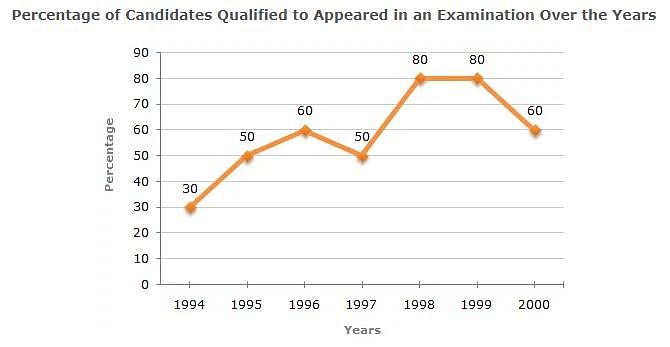
Q. If the total number of candidates appeared in 1996 and 1997 together was 47400, then the total number of candidates qualified in these two years together was?
Direction: The following line graph gives the percentage of the number of candidates who qualified an examination out of the total number of candidates who appeared for the examination over a period of seven years from 1994 to 2000.
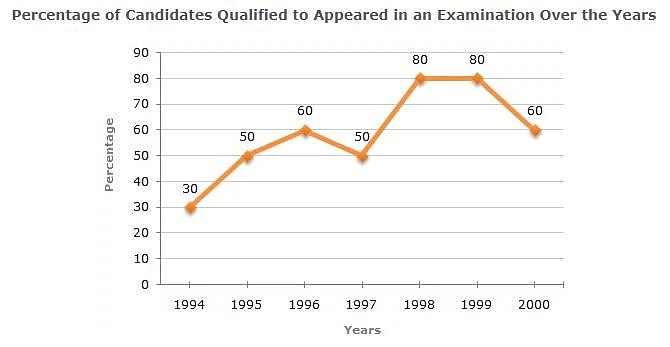
Q. The total number of candidates qualified in 1999 and 2000 together was 33500 and the number of candidates appeared in 1999 was 26500. What was the number of candidates in 2000?
Direction: The following line graph gives the percentage of the number of candidates who qualified an examination out of the total number of candidates who appeared for the examination over a period of seven years from 1994 to 2000.
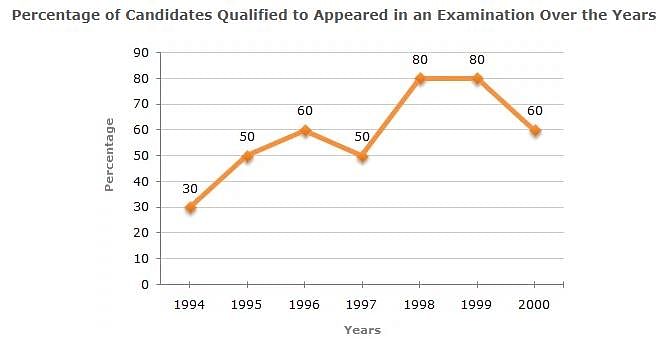
Q. If the number of candidates qualified in 1998 was 21200, what was the number of candidates appeared in 1998?
Direction: The following line graph gives the percentage of the number of candidates who qualified an examination out of the total number of candidates who appeared for the examination over a period of seven years from 1994 to 2000.
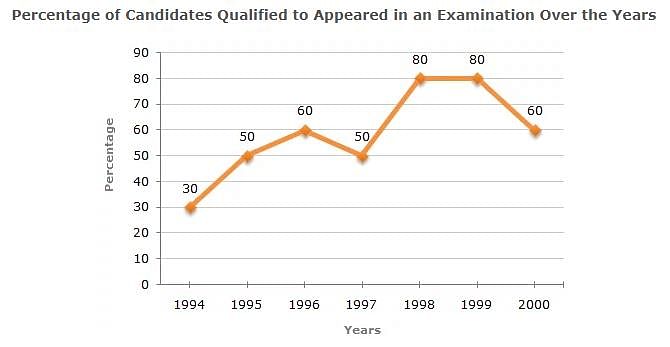
Q. In which pair of years was the number of candidates qualified, the same?
Study the following line graph and answer the questions based on it.
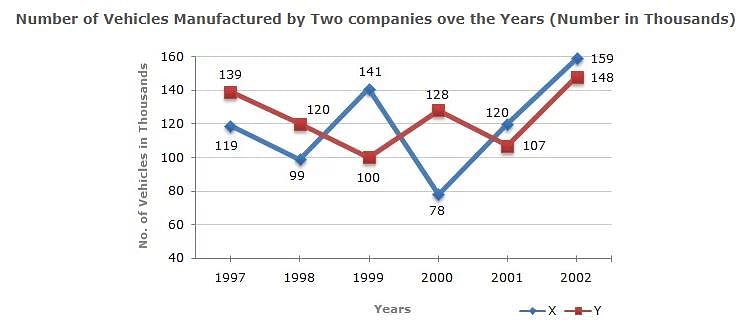
Q. What is the difference between the total productions of the two Companies in the given years?
Study the following line graph and answer the questions based on it.
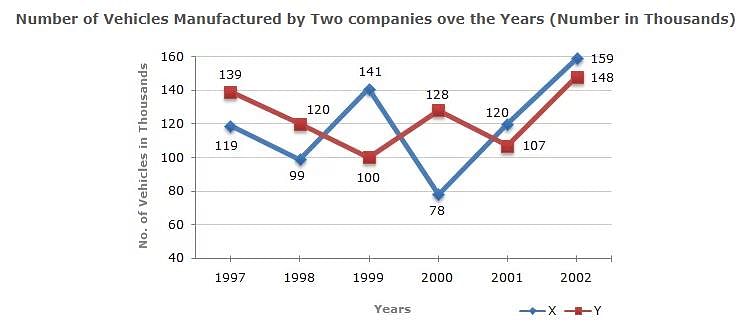
Q. What is the average numbers of vehicles manufactured by Company X over the given period ? (rounded off to nearest integer)
Study the following line graph and answer the questions based on it.
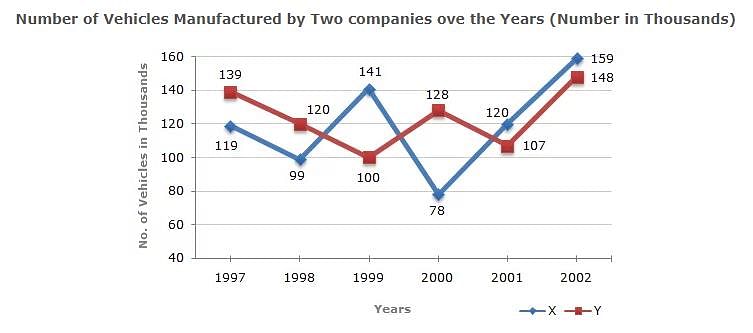
Q. In which of the following years, the difference between the productions of Companies X and Y was the maximum among the given years?
Study the following line graph and answer the questions based on it.
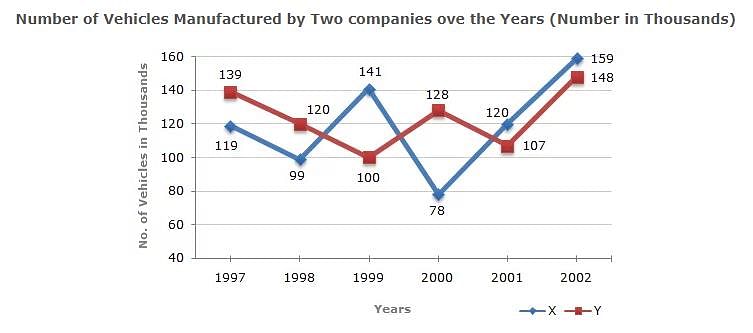
Q. The production of Company Y in 2000 was approximately what percent of the production of Company X in the same year?
Study the following line graph and answer the questions based on it.
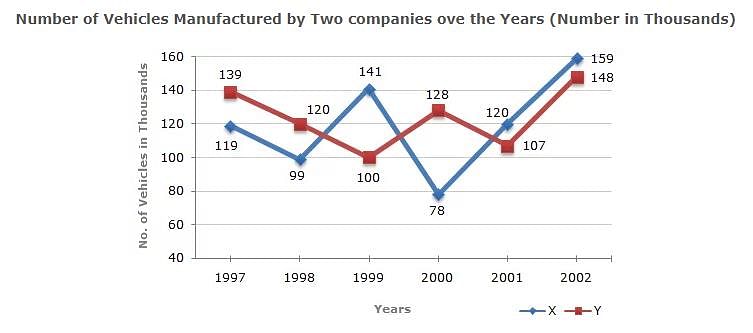
Q. What is the difference between the number of vehicles manufactured by Company Y in 2000 and 2001?
|
314 videos|170 docs|185 tests
|
|
314 videos|170 docs|185 tests
|


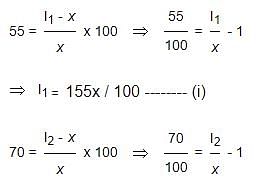
 I2 = 170X / 100 ----- (ii)
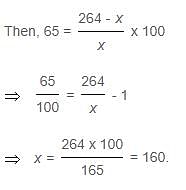
 Expenditure in 1998 = ₹ 160 crores.
 Number of candidates qualified in 2000 = (33500 - 21200) = 12300.


