Important Questions Test: Data Handling - Class 6 MCQ
20 Questions MCQ Test Mathematics (Maths) Class 6 - Important Questions Test: Data Handling

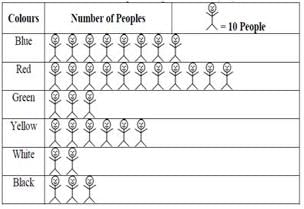
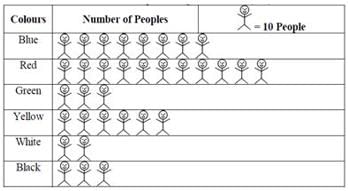
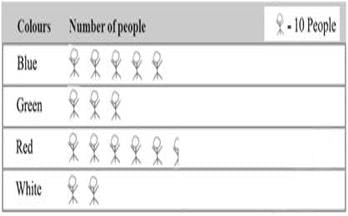
The colours of fridges preferred by people living in a locality are shown by the following pictograph. Find the number of people preferring white colour.
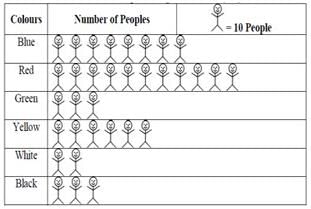
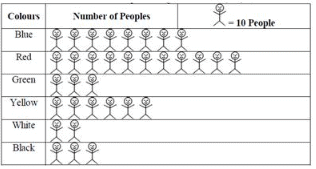
The colours of fridges preferred by people living in a locality are shown by the following pictograph. Find the number of people preferring yellow colour.

The width or size of the class interval 30-40 is:
The colours of fridges preferred by people living in a locality are shown by the following pictograph. Which two colours liked by same number of people?
A _____ is a collection of numbers gathered to give some information.
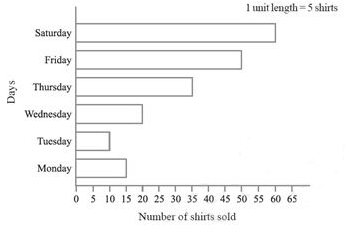
Observe this bar graph which is showing the sale of shirts in a ready-made shop from Monday to Saturday. On which day were the maximum number of shirts sold?

Observe this bar graph which is showing the sale of shirts in a ready-made shop from Monday to Saturday. How many shirts were sold on Thursday?
Which of the following is the probability of an impossible event?
Observe this bar graph which is showing the sale of shirts in a ready-made shop from Monday to Saturday. On which day were the minimum number of shirts sold?

Observe this bar graph which is showing the sale of shirts in a ready-made shop from Monday to Saturday. How many shirts were sold on Monday?

A ________ represents data through pictures of objects.
Observe this bar graph which is showing the sale of shirts in a ready-made shop from Monday to Saturday. How many shirts were sold on Wednesday?

Bars of uniform width can be drawn ____________ with equal spacing between them and then the length of each bar represents the given number.
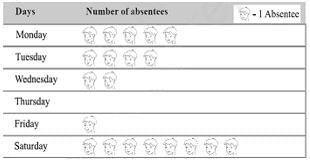
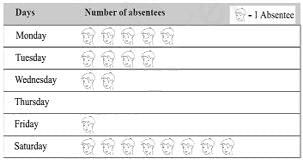
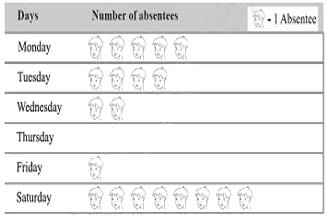
The following pictograph shows the number of absentees in a class of 30 students during the previous week. On which day were the maximum number of students absent?
The ________ of each bar gives the required information.
The following pictograph shows the number of absentees in a class of 30 students during the previous week. Which day had full attendance?
The colours of fridges preferred by people living in a locality are shown by the following pictograph. Find the number of people preferring blue colour.
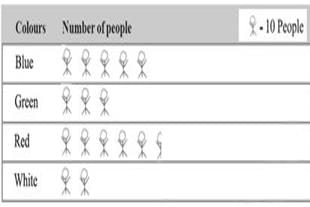
The colours of fridges preferred by people living in a locality are shown by the following pictograph. How many people liked red colour?
The following pictograph shows the number of absentees in a class of 30 students during the previous week. What was the total number of absentees in that week?
The colours of fridges preferred by people living in a locality are shown by the following pictograph. Find the number of people preferring green colour.
|
92 videos|348 docs|54 tests
|


Important Questions Test: Data Handling
Important Questions Test: Data Handling MCQs with Answers
Online Tests for Important Questions Test: Data Handling Mathematics (Maths) Class 6
|
© EduRev
|
Education Revolution
|


|


