Test: Data Handling - 2 - Class 4 MCQ
10 Questions MCQ Test Mathematics for Class 4 - Test: Data Handling - 2

Directions: Given bar graph represents the number of students of different classes of a school who participated in a competition.
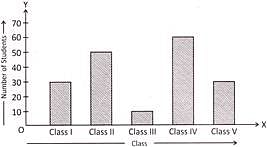
Study the bar graph and answer the questions below:
How many more students of class IV participated in the competition in comparison to class III?
| 1 Crore+ students have signed up on EduRev. Have you? Download the App |
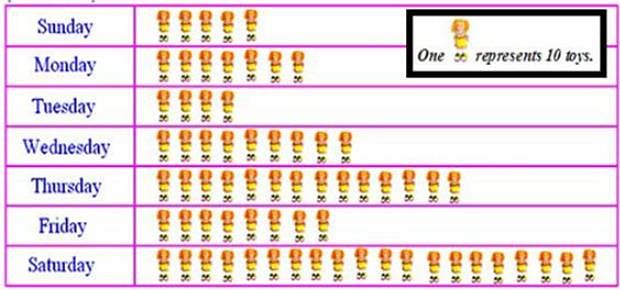
Given pictograph represent the different number of plants that were planted by the students of school in a particular week.
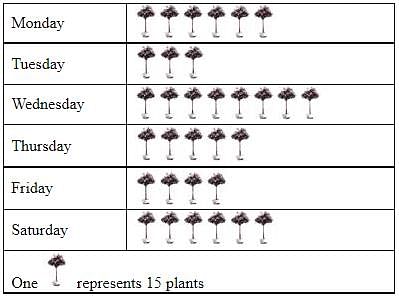
What is the difference between maximum and minimum number of plants that were planted on two days in the week?
The ages in years of 10 teachers of a school are: 32, 41, 28, 54, 35, 26, 23, 33, 38, 40. What is the age of the youngest teacher?
Directions: Given line graph represents the number of people in a store since its opening till closing at various times of a day.
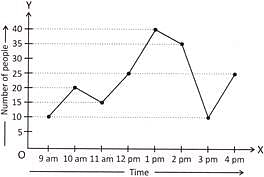
Study the line graph and answer the questions given below:
What was the busiest time of the day at the store?
Directions: Given bar graph represents the number of students of different classes of a school who participated in a competition.

Study the bar graph and answer the questions below:
How many students of class II and class V altogether participated in the competition?
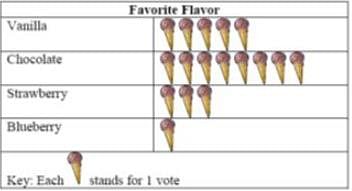
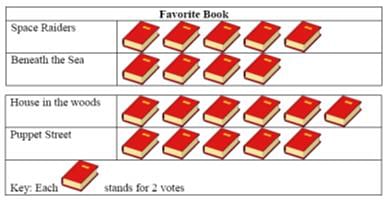
How many more children voted for Puppet Street than voted for Beneath the Sea?
Given pie chart represents the number of books on different subjects sold by a book seller.
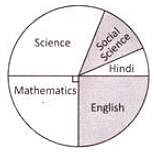
Of which two subjects, the books sold by the book seller were equal in number?
|
28 videos|110 docs|30 tests
|
|
28 videos|110 docs|30 tests
|
Top Courses for Class 4
Important Questions for Test: Data Handling - 2
Test: Data Handling - 2 MCQs with Answers
Online Tests for Test: Data Handling - 2 Mathematics for Class 4
|
© EduRev
|
Education Revolution
|


Follow Us
|


within 7 days!