Class 5 Exam  >  Class 5 Tests  >  Mathematics for Class 5  >  Test: Data Handling - 1 - Class 5 MCQ

Test: Data Handling - 1 - Class 5 MCQ


Test Description

10 Questions MCQ Test Mathematics for Class 5 - Test: Data Handling - 1

Test: Data Handling - 1 for Class 5 2024 is part of Mathematics for Class 5 preparation. The Test: Data Handling - 1 questions and answers have been prepared according to the Class 5 exam syllabus.The Test: Data Handling - 1 MCQs are made for Class 5 2024 Exam. Find important definitions, questions, notes, meanings, examples, exercises, MCQs and online tests for Test: Data Handling - 1 below.
Solutions of Test: Data Handling - 1 questions in English are available as part of our Mathematics for Class 5 for Class 5 & Test: Data Handling - 1 solutions in Hindi for Mathematics for Class 5 course. Download more important topics, notes, lectures and mock test series for Class 5 Exam by signing up for free. Attempt Test: Data Handling - 1 | 10 questions in 10 minutes | Mock test for Class 5 preparation | Free important questions MCQ to study Mathematics for Class 5 for Class 5 Exam | Download free PDF with solutions
Test: Data Handling - 1 - Question 1

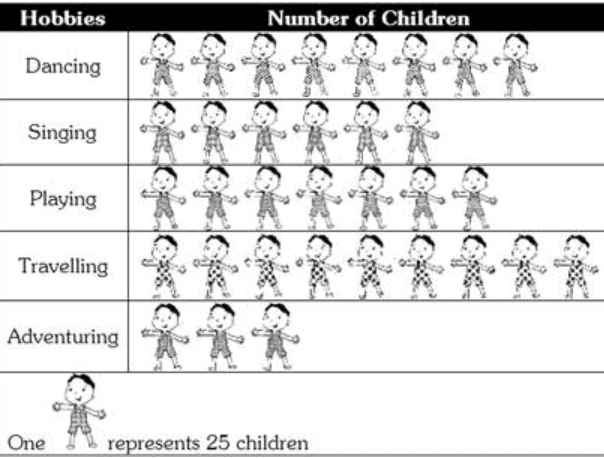
How many children are there whose hobby is adventuring?

Detailed Solution for Test: Data Handling - 1 - Question 1
  • As we can see there are three children in the adventure segment
  • each student represents 25 students
  • therefore, 3 × 25 = 75.
  • There are 75 children whose hobby is adventuring.
Test: Data Handling - 1 - Question 2

Find the number of children whose hobby is either travelling or adventuring?
Detailed Solution for Test: Data Handling - 1 - Question 2
  • Number of children whose hobby is travelling = 9 × 25 = 225
  • Number of children whose hobby is adventuring = 3×25=75
  • Total number of children whose hobby is either travelling or adventuring = 225 + 75 = 300.
1 Crore+ students have signed up on EduRev. Have you? Download the App
Test: Data Handling - 1 - Question 3

The marks obtained in 4 subjects in an examination are 200. If the average of marks obtained in 3 subjects is 48, then how many marks are obtained in fourth subject?

Detailed Solution for Test: Data Handling - 1 - Question 3
  • Total marks obtained in 4 subjects = 200 Average of 3 subjects = 48 Total sum of 3 subjects =  48 × 3 = 144
  • Fourth subject Marks = Total marks obtained - Total sum of 3 subjects.              
  • = 200 - 155 = 56.
Test: Data Handling - 1 - Question 4

From the following graph determine which year faced maximum price rise in India in comparison to the preceding are:
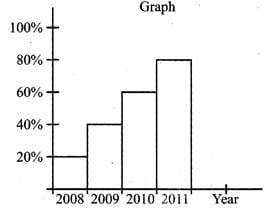
Detailed Solution for Test: Data Handling - 1 - Question 4
  • Let the initial price = Rs 100
  • In 2009, maximum price rise = 
  • In 2010, maximum price rise = 
  • In 2011, maximum price rise = 
  • So. Maximum price rise in India in comparison to the preceding year is 2009
Test: Data Handling - 1 - Question 5

If, ↑ represents 5 houses, then the number of houses represented by↑↑↑↑ are:

Detailed Solution for Test: Data Handling - 1 - Question 5
  • The four arrows will represent = 5 x 4 = 20 houses
Test: Data Handling - 1 - Question 6

A graph drawn using pictures is called:

Detailed Solution for Test: Data Handling - 1 - Question 6
  • A graph that conveys its meaning using pictures is called pictograph.
  • A graph drawn using pictures is called
Test: Data Handling - 1 - Question 7

A pictorial representation of data is called _______.

Detailed Solution for Test: Data Handling - 1 - Question 7
  • Among different type of data representations possible, the representation which consists of pictures i.e A pictorial representation of data is called pictograph.
  • The pictorial representation of data is called A attractive class 9 maths  CBSE
Test: Data Handling - 1 - Question 8

The pictograph shows the distances of towns W, X and Y from town Z.

Which of the following is farthest Z ?

Detailed Solution for Test: Data Handling - 1 - Question 8
  • Team W and X have 3 balls whereas Team Y have 5 balls .
  •  As Y have 5 Balls so it is farthest from Z 
Test: Data Handling - 1 - Question 9

The bar graph shows the grades obtained by a group of pupils in a test.
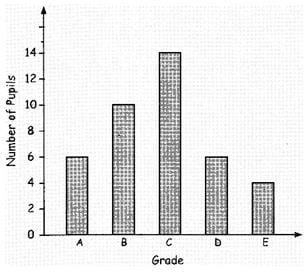
If grade C is the passing mark, how many pupils passed the test?

Detailed Solution for Test: Data Handling - 1 - Question 9
  • Minimum criteria to pass th exam is by getting a C grade.
  • Number of pupils passed by grade C = 14
  • Number of pupils passed by grade B = 10
  • Number of pupils passed by grade A = 6
  • Total number of passed students =14 + 10 + 6 = 30
Test: Data Handling - 1 - Question 10

The mode of a set of observations is the value which

Detailed Solution for Test: Data Handling - 1 - Question 10
  • By definition, mode is the value which occurs most frequently.
  • therefore option A is correct
  • for example 1, 3, 3, 5, 7, 8, 3, 4 , 5, 7.
  • So out of the given entries 3 is the mode because it occured the most times.
58 videos|112 docs|40 tests
Information about Test: Data Handling - 1 Page
In this test you can find the Exam questions for Test: Data Handling - 1 solved & explained in the simplest way possible. Besides giving Questions and answers for Test: Data Handling - 1, EduRev gives you an ample number of Online tests for practice

Top Courses for Class 5

58 videos|112 docs|40 tests
Download as PDF

Top Courses for Class 5