Test: Tables - 1 - UCAT MCQ
20 Questions MCQ Test Quantitative Reasoning for UCAT - Test: Tables - 1
Directions : Study the following table chart carefully and answer the questions given beside.
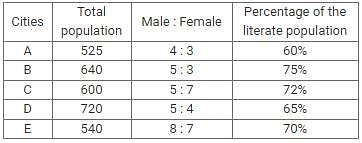
The table given below shows the total population of the five different cities, the ratio of the male to female population and the percentage of the literate population.
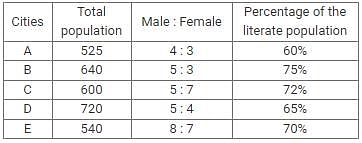
Q. The literate population in city C is how much percentage more than the male population in city D?
The table given below shows the total population of the five different cities, the ratio of the male to female population and the percentage of the literate population.

Directions : Study the following table chart carefully and answer the questions given beside.
The table given below shows the total population of the five different cities, the ratio of the male to female population and the percentage of the literate population.
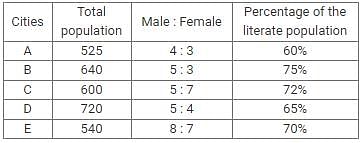
Q. If the ratio of the male to female literate population in city B is 8 : 7, find the female illiterate population in city B.
The table given below shows the total population of the five different cities, the ratio of the male to female population and the percentage of the literate population.

| 1 Crore+ students have signed up on EduRev. Have you? Download the App |
Directions : Study the following table chart carefully and answer the questions given beside.
The table given below shows the total population of the five different cities, the ratio of the male to female population and the percentage of the literate population.

Q. Find the average of the female population in city A, B and E together.
The table given below shows the total population of the five different cities, the ratio of the male to female population and the percentage of the literate population.

Directions : Study the following table chart carefully and answer the questions given beside.
The table given below shows the total population of the five different cities, the ratio of the male to female population and the percentage of the literate population.

Q. What is the sum of the illiterate population in city D and E together?
Directions : Study the following table chart carefully and answer the questions given beside.
The table given below shows the total population of the five different cities, the ratio of the male to female population and the percentage of the literate population.
Q. What is the difference between the total population in city A and C together and the total population in city B and E together?
Directions : Read the following table chart carefully and answer the questions given beside.
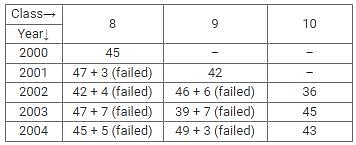
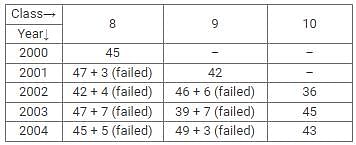
The following table shows the number of students in classes 8, 9 and 10 in a school. The school started in 2000 and students are admitted only in class 8. At the end of the year the students who pass the final exams get promoted to the next class while the students who fail stay in the same class and are joined by a new bunch of students, who are either promoted (class 9 and 10) or who joined the school new (class 8). All students who pass the class 10 exams pass out of the school.
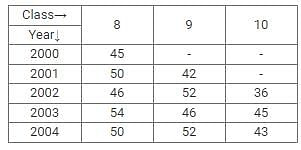
No student in class 10 failed in any of the years and no student failed in the same class more than once.
Q. How many students joined the school from 2000 to 2004?
Directions : Read the following table chart carefully and answer the questions given beside.
The following table shows the number of students in classes 8, 9 and 10 in a school. The school started in 2000 and students are admitted only in class 8. At the end of the year the students who pass the final exams get promoted to the next class while the students who fail stay in the same class and are joined by a new bunch of students, who are either promoted (class 9 and 10) or who joined the school new (class 8). All students who pass the class 10 exams pass out of the school.

No student in class 10 failed in any of the years and no student failed in the same class more than once.
Q. How many students studying in class 9 in the year 2003, failed in the final exams?
Directions : Read the following table chart carefully and answer the questions given beside.
The following table shows the number of students in classes 8, 9 and 10 in a school. The school started in 2000 and students are admitted only in class 8. At the end of the year the students who pass the final exams get promoted to the next class while the students who fail stay in the same class and are joined by a new bunch of students, who are either promoted (class 9 and 10) or who joined the school new (class 8). All students who pass the class 10 exams pass out of the school.

No student in class 10 failed in any of the years and no student failed in the same class more than once.
Q. What percentage of the students who joined the school from 2000 to 2002, passed out of the school by 2003?
Directions : Read the following table chart carefully and answer the questions given beside.
The following table shows the number of students in classes 8, 9 and 10 in a school. The school started in 2000 and students are admitted only in class 8. At the end of the year the students who pass the final exams get promoted to the next class while the students who fail stay in the same class and are joined by a new bunch of students, who are either promoted (class 9 and 10) or who joined the school new (class 8). All students who pass the class 10 exams pass out of the school.

No student in class 10 failed in any of the years and no student failed in the same class more than once.
Q. Approximately what percentage of the students in class 8 in 2002, passed the final exams?
Directions : Read the following table chart carefully and answer the questions given beside.
The following table shows the number of students in classes 8, 9 and 10 in a school. The school started in 2000 and students are admitted only in class 8. At the end of the year the students who pass the final exams get promoted to the next class while the students who fail stay in the same class and are joined by a new bunch of students, who are either promoted (class 9 and 10) or who joined the school new (class 8). All students who pass the class 10 exams pass out of the school.

No student in class 10 failed in any of the years and no student failed in the same class more than once.
Q. The total number of students who failed in class 8 from 2000 to 2003 is
Directions : Study the following table chart carefully and answer the questions given beside.

Number of candidates appeared for the interview and % of candidates selected out of those who appeared from 2015 to 2019 in a company XYZ.
Q. Find the average number of candidates who were not selected in HR department in 2016 and 2017 together?
Directions : Study the following table chart carefully and answer the questions given beside.

Number of candidates appeared for the interview and % of candidates selected out of those who appeared from 2015 to 2019 in a company XYZ.
Q. Find the ratio between the total numbers of candidates appeared for the interview in marketing department from 2016 to 2018 together and the total number of candidates appeared for the interview in HR department from year 2017 to 2019 together?
Directions : Study the following table chart carefully and answer the questions given beside.
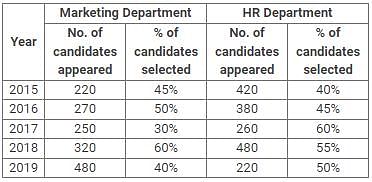
Number of candidates appeared for the interview and % of candidates selected out of those who appeared from 2015 to 2019 in a company XYZ.
Q. Find the average number of candidates appeared for the interview in HR from year 2015 to 2018 together?
Directions : Study the following table chart carefully and answer the questions given beside.

Number of candidates appeared for the interview and % of candidates selected out of those who appeared from 2015 to 2019 in a company XYZ.
Q. Number of candidates who were not selected in marketing department in 2017 is what percentage of the number of candidates who were not selected in HR department in the same year?
Directions : Study the following table chart carefully and answer the questions given beside.

Number of candidates appeared for the interview and % of candidates selected out of those who appeared from 2015 to 2019 in a company XYZ.
Q. Find the difference between the total number of candidates who were selected in Marketing in the year 2016 and total number of candidates who were not selected in HR in the year 2019.
Directions : Study the following table chart carefully and answer the questions given beside.
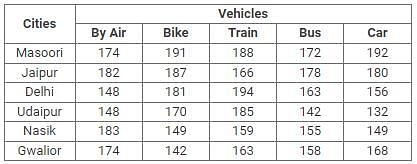
Number of tourists who visit different cities by different modes of transport is given in the table.
Q. What is the percentage of tourists who went to Udaipur by Train as compared to the tourists who went to delhi by Air?
Directions : Study the following table chart carefully and answer the questions given beside.
Number of tourists who visit different cities by different modes of transport is given in the table.

Q. What is the respective ratio of the number of tourists went to Jaipur by car to the number of tourists who went to Nasik by bus?
Directions : Study the following table chart carefully and answer the questions given beside.
Number of tourists who visit different cities by different modes of transport is given in the table.
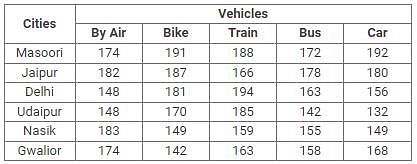
Q. What is the average number of tourists who travelled by Bike?
Directions : Study the following table chart carefully and answer the questions given beside.
Number of tourists who visit different cities by different modes of transport is given in the table.

Q. What is the difference between the average numbers of tourists who travelled by Air and the average number of tourists who travelled by Bus?
Directions : Study the following table chart carefully and answer the questions given beside.
Number of tourists who visit different cities by different modes of transport is given in the table.
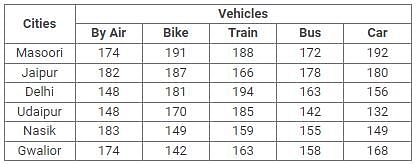
Q. What is the difference between the total number of tourists who went to Masoori and Gwalior by all vehicles?
|
34 videos|17 docs|16 tests
|
|
34 videos|17 docs|16 tests
|


