Test: Data Interpretation- 5 - SSC CGL MCQ
20 Questions MCQ Test SSC CGL Tier 2 - Study Material, Online Tests, Previous Year - Test: Data Interpretation- 5

Study the following graph carefully to answer the given questions
Down Stream Distance = 200 km Up Stream Distance = 300 km
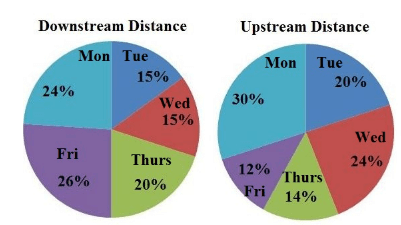
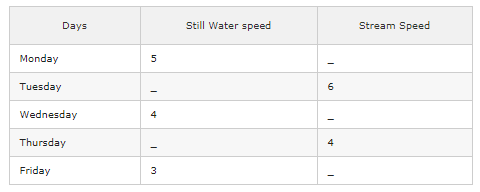
A boatman rows down stream at 6kmph on Wednesday. Find the speed of upstream and Speed of current?
Study the following graph carefully to answer the given questions
Down Stream Distance = 200 km Up Stream Distance = 300 km
A boatman rows up stream at 4kmph, 2 kmph and 8 kmph on Monday, Wednesday and Thursday respectively. Then find the ratio between the down stream speed of boat on Monday, Wednesday, and Thursday together and the rate of current on the same days together?
| 1 Crore+ students have signed up on EduRev. Have you? Download the App |
Study the following graph carefully to answer the given questions
Down Stream Distance = 200 km Up Stream Distance = 300 km
A boatman rows up stream at 16 kmph and 2 kmph on Tuesday and Friday. Then find the difference between the down stream speed of boat on Tuesday and Friday together and the speed of boat in still water on the same days together?
Study the following graph carefully to answer the given questions
Down Stream Distance = 200 km Up Stream Distance = 300 km
What time will be taken by a boat to cover a distance on Tuesday along the stream, if the up stream of boat is 3 kmph?
Study the following graph carefully to answer the given questions
Down Stream Distance = 200 km Up Stream Distance = 300 km
What is the sum of total distance travelled by the boat on Monday, Wednesday and Friday together?
Study the following graph carefully to answer the given questions
Down Stream Distance = 200 km Up Stream Distance = 300 km
Find the ratio between the down stream distance travelled by boat on Monday, Wednesday, Thursday and Friday together and the Up stream distance travelled by the boat on the same days together?
Study the following graph carefully to answer the given questions
Down Stream Distance = 200 km Up Stream Distance = 300 km
Find the difference between the up stream distance travelled by boat on Tuesday and Friday together and the down stream distance travelled by boat on the same days together?
Study the following graph carefully to answer the given questions
Down Stream Distance = 200 km Up Stream Distance = 300 km
Total downstream distance travelled by boat on Monday, Tuesday and Wednesday together is what percentage of total upstream distance travelled by boat on the same days together?
Study the following graph carefully to answer the given questions
Down Stream Distance = 200 km Up Stream Distance = 300 km
A boatman rows down stream at 6kmph on Wednesday. Find the time taken by the boat to cover upsream distance on the same day?
Study the following graph carefully to answer the given questions
Down Stream Distance = 200 km Up Stream Distance = 300 km
A boatman rows up stream at 16 kmph on Tuesday. Find the approximate time taken by the boat to cover downstream distance on the same day?
(Q.no: 11-15). Refer to the table and answer the given questions.
NA refers the data which is not needed for a particular question. The number of working days of A, B, C, D is given below and some of them are missing. Take the data of the first row for the first question and the second row for the second question and so on.
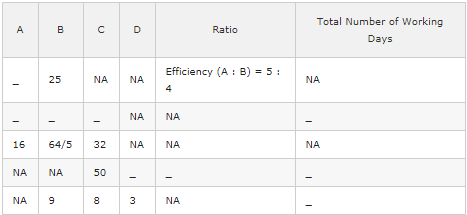
A started a work alone and then B joined her 5 days before actual completion of the work. For how many days A worked alone?
(Q.no: 11-15). Refer to the table and answer the given questions.
NA refers the data which is not needed for a particular question. The number of working days of A, B, C, D is given below and some of them are missing. Take the data of the first row for the first question and the second row for the second question and so on.
Working together B and C take 50% more number of days than A, B and C together take and A and B working together, take 8/3 more number of days than A, B and C take together. If A, B and C all have worked together till the completion of the work and B has received Rs.120 out of total earnings of Rs. 480 then in how many days did A, B and C together complete the whole work?
(Q.no: 11-15). Refer to the table and answer the given questions.
NA refers the data which is not needed for a particular question. The number of working days of A, B, C, D is given below and some of them are missing. Take the data of the first row for the first question and the second row for the second question and so on.
All of them started to work together but A leaves after 4 days. B leaves the job 3 days before the completion of the work. How long would the work last?
(Q.no: 11-15). Refer to the table and answer the given questions.
NA refers the data which is not needed for a particular question. The number of working days of A, B, C, D is given below and some of them are missing. Take the data of the first row for the first question and the second row for the second question and so on.
C started the work and left after some days, when 25% work was done. After it D joined and completed it working for 25 days. In how many days C and D can do the complete work, working together?
(Q.no: 11-15). Refer to the table and answer the given questions.
NA refers the data which is not needed for a particular question. The number of working days of A, B, C, D is given below and some of them are missing. Take the data of the first row for the first question and the second row for the second question and so on.
B and C started the work. After 3 days D joined them. What is the total number of days in which they had completed the work?
(Q.no: 16 -20). Refer to the table and answer the given questions.
NA refers the data which is not needed for a particular question. The price details of 5 products are given below and some of them are missing. Take the data of the first row for the first question and the second row for the second question and so on.
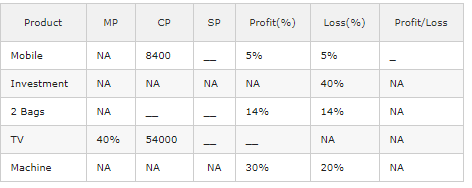
Rahul purchased a mobile and sold it for a loss(loss % given in the table). From that money, he purchased another article and sold it for a gain of (Profit % given in the table). What is the overall gain or loss?
(Q.no: 16 -20). Refer to the table and answer the given questions.
NA refers the data which is not needed for a particular question. The price details of 5 products are given below and some of them are missing. Take the data of the first row for the first question and the second row for the second question and so on.
A, B and C invests rupees 8000, 12000 and 10000 respectively in a business. At the end of the year the balance sheet shows a loss of initial investment. Find the share of loss of B.
(Q.no: 16 -20). Refer to the table and answer the given questions.
NA refers the data which is not needed for a particular question. The price details of 5 products are given below and some of them are missing. Take the data of the first row for the first question and the second row for the second question and so on.
A Shop Keeper sells two bags for Rs. 500 each. On one, he gets % profit(as per the table) and on the other he gets % loss(as per the table). His profit or loss in the entire transaction was?
(Q.no: 16 -20). Refer to the table and answer the given questions.
NA refers the data which is not needed for a particular question. The price details of 5 products are given below and some of them are missing. Take the data of the first row for the first question and the second row for the second question and so on.
The price of TV was marked up by %(as per the table).It was sold at a discount of 20% on the marked price. What was the profit percent of the cost price?
(Q.no: 16 -20). Refer to the table and answer the given questions.
NA refers the data which is not needed for a particular question. The price details of 5 products are given below and some of them are missing. Take the data of the first row for the first question and the second row for the second question and so on.
Preethi sold a machine to Shalini at a profit of %(as per table). Shalini sold this machine to Arun at a loss of %(as per table). If Preethi paid Rs.5000 for this machine, then find the cost price of machine for Arun?
|
1365 videos|1312 docs|1010 tests
|
|
1365 videos|1312 docs|1010 tests
|
Top Courses for SSC CGL


Important Questions for Data Interpretation- 5
Data Interpretation- 5 MCQs with Answers
Online Tests for Data Interpretation- 5 SSC CGL Tier 2 - Study Material, Online Tests, Previous Year
|
© EduRev
|
Education Revolution
|


Follow Us
|


