SSC CGL Previous Year Questions: Data Interpretation - 5 - SSC CGL MCQ
30 Questions MCQ Test SSC CGL Mathematics Previous Year Paper (Topic-wise) - SSC CGL Previous Year Questions: Data Interpretation - 5

DIRECTIONS: The sub divided bar diagram given below depicts H.S. Students of a school for three years. Study the diagram and answer the questions. (SSC CGL 1st Sit. 2013)

Q. In which year the school had the best result for H.S. in respect of percentage of pass candidates?
DIRECTIONS: The sub divided bar diagram given below depicts H.S. Students of a school for three years. Study the diagram and answer the questions. (SSC CGL 1st Sit. 2013)
Q. The number of students passed in third division in the year 2008 was
| 1 Crore+ students have signed up on EduRev. Have you? Download the App |
DIRECTIONS: The sub divided bar diagram given below depicts H.S. Students of a school for three years. Study the diagram and answer the questions. (SSC CGL 1st Sit. 2013)
Q. The percentage of the students passed in 2nd division in the year 2010 was
DIRECTIONS: The adjacent histogram shows the average pocket money received by 60 students for a span of one month. Study the diagram and answer the question. (SSC CGL 1st Sit. 2013)
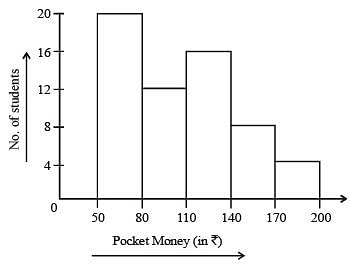
Q. Maximum number of students received pocket money between
DIRECTIONS: The adjacent histogram shows the average pocket money received by 60 students for a span of one month. Study the diagram and answer the question. (SSC CGL 1st Sit. 2013)

Q. The number of students who received pocket money upto ₹ 140 is
DIRECTIONS: The pass percentage for an examination in a school is shown in the adjoining bar diagram, for males and females separately for four years. Study the diagram and answer the question. (SSC CGL 1st Sit. 2013)
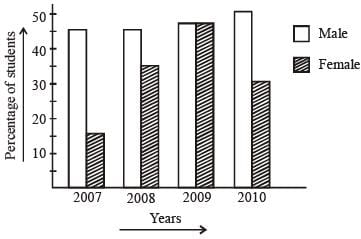
Q. The maximum percentage of students passed in the year is
DIRECTIONS: The pass percentage for an examination in a school is shown in the adjoining bar diagram, for males and females separately for four years. Study the diagram and answer the question. (SSC CGL 1st Sit. 2013)

Q. The year in which the difference of pass percentage between male and female is maximum, is
DIRECTIONS: The following graph shows the expenditure incurred in bringing a book, by a magazine producer. Study the graph and answer question. (SSC CGL 1st Sit. 2013)

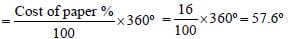
Q. What should be the central angle of the sector for the cost of the paper?
DIRECTIONS: The following graph shows the expenditure incurred in bringing a book, by a magazine producer. Study the graph and answer question. (SSC CGL 1st Sit. 2013)

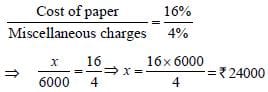
Q. If the miscellaneous charges are ₹ 6,000, the cost of paper is
DIRECTIONS: The following graph shows the expenditure incurred in bringing a book, by a magazine producer. Study the graph and answer question. (SSC CGL 1st Sit. 2013)
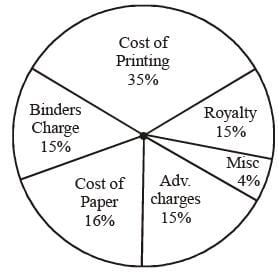
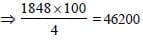
Q. If 5500 copies are published, miscellaneous expenditures amount to ₹ 1,848, find the cost price of 1 copy.
DIRECTIONS: The following pie-chart shows the marks scored by a student in different subject - viz. Physics (Ph), Chemistry (Ch), Mathematical (M), Social Science (SS) and English (E) in an examination. Assuming that total marks obtained for the examination in 810, answer the questions given below. (SSC CGL 1st Sit. 2013)

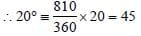
Q. The subject in which the student obtained 135 marks is


DIRECTIONS: The following pie-chart shows the marks scored by a student in different subject - viz. Physics (Ph), Chemistry (Ch), Mathematical (M), Social Science (SS) and English (E) in an examination. Assuming that total marks obtained for the examination in 810, answer the questions given below. (SSC CGL 1st Sit. 2013)
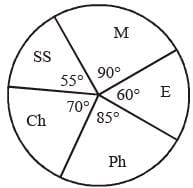
Q. The marks obtained in English, Physics and Social Science exceed the marks obtained in Mathematics and Chemistry by
DIRECTIONS: The following pie-chart shows the marks scored by a student in different subject - viz. Physics (Ph), Chemistry (Ch), Mathematical (M), Social Science (SS) and English (E) in an examination. Assuming that total marks obtained for the examination in 810, answer the questions given below. (SSC CGL 1st Sit. 2013)

Q. The difference of marks between Physics and Chemistry is same as that between
DIRECTIONS: The following pie-chart shows the marks scored by a student in different subject - viz. Physics (Ph), Chemistry (Ch), Mathematical (M), Social Science (SS) and English (E) in an examination. Assuming that total marks obtained for the examination in 810, answer the questions given below. (SSC CGL 1st Sit. 2013)

Q. The marks obtained in Mathematics and Chemistry exceed the marks obtained in Physics and Social Science by
DIRECTIONS: Shown below is the multiple bar diagram depicting the changes in the roll strength of a college in four faculties from 2001 – 02 to 2003 – 04. (SSC CGL 1st Sit.2013)
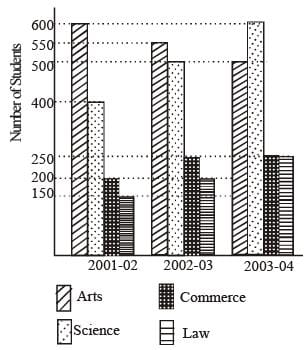
Q. The percentage of students in Science faculty in 2001 – 2002 is
DIRECTIONS: Shown below is the multiple bar diagram depicting the changes in the roll strength of a college in four faculties from 2001 – 02 to 2003 – 04. (SSC CGL 1st Sit.2013)

Q. The percentage of students in Law faculty in 2003 – 04 is
DIRECTIONS: Shown below is the multiple bar diagram depicting the changes in the roll strength of a college in four faculties from 2001 – 02 to 2003 – 04. (SSC CGL 1st Sit.2013)
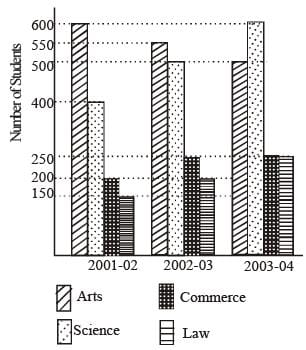
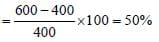
Q. Percentage of increase in Science students in 2003 – 04 over 2001 – 2002 is
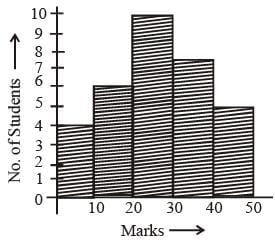
DIRECTIONS: Study the following histogram and answer the following. (SSC CGL 2nd Sit.2013)

Q. The total number of studen ts in volved in the data is
DIRECTIONS: Study the following histogram and answer the following. (SSC CGL 2nd Sit.2013)
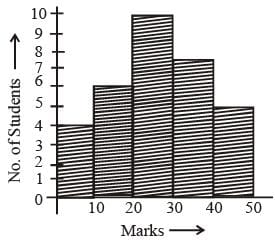
Q. The maximum number of students got the marks in the interval of
DIRECTIONS: Study the following histogram and answer the following. (SSC CGL 2nd Sit.2013)

Q. The least number of students got the marks in the interval
DIRECTIONS: Study the following histogram and answer the following. (SSC CGL 2nd Sit.2013)

Q. The ratio of the students obtaining marks in the first and the last interval is
DIRECTIONS: Study the following histogram and answer the following. (SSC CGL 2nd Sit.2013)
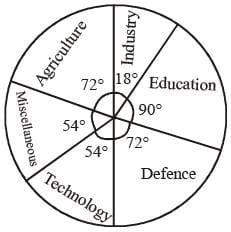
Q. In a certain country, allocations to various sectors of the yearly budget per ₹ 1000 crores are represented by this piediagram. The expenditure (in ₹) on Agriculture is
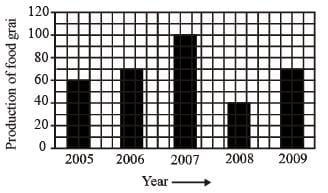
Study the above bar graph showing the production of food grains (in million tons). (SSC CGL 2nd Sit.2013)
What is the ratio between the maximum production and the minimum production during the given period?
DIRECTIONS: Study the two pie-charts and answer the questions. (SSC CGL 1st Sit. 2013)


Q. The average amount spent on Education, Grocery and Savings from April month's salary is :
DIRECTIONS: Study the two pie-charts and answer the questions. (SSC CGL 1st Sit. 2013)

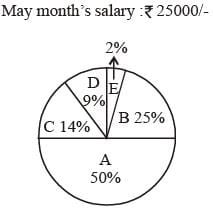
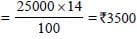
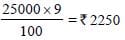
Q. From the salary of May, the amount spent on Grocery and Electricity are :
DIRECTIONS: Study the two pie-charts and answer the questions. (SSC CGL 1st Sit. 2013)
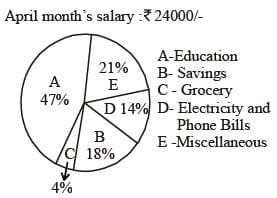

Q. The ratio of amount spent for savings in April month's salary and miscellaneous in May month's salary is :

DIRECTIONS: Study the two pie-charts and answer the questions. (SSC CGL 1st Sit. 2013)
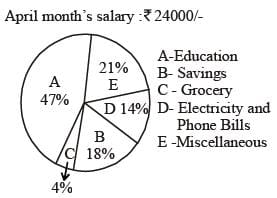

Q. What is the percent increase in Education in May month than April month ?
DIRECTIONS: The following pie-chart shows the number of students admitted in different faculties of a college. Study the chart and answer the question. (SSC CGL 1st Sit.2013)

Q. If 1000 students are admitted in science, what is the total number of students?
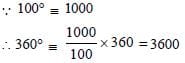
DIRECTIONS: The following pie-chart shows the number of students admitted in different faculties of a college. Study the chart and answer the question. (SSC CGL 1st Sit.2013)
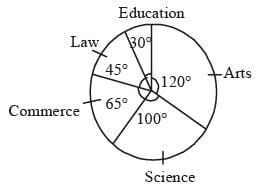
Q. If 1000 students are admitted in science, what is the ratio of students in science and arts?
DIRECTIONS: The following pie-chart shows the number of students admitted in different faculties of a college. Study the chart and answer the question. (SSC CGL 1st Sit.2013)

Q. How many students are more in commerce than in law if 1000 students are in science?
|
21 docs|55 tests
|
|
21 docs|55 tests
|
Top Courses for SSC CGL


Important Questions for SSC CGL Previous Year Questions: Data Interpretation - 5
SSC CGL Previous Year Questions: Data Interpretation - 5 MCQs with Answers
Online Tests for SSC CGL Previous Year Questions: Data Interpretation - 5 SSC CGL Mathematics Previous Year Paper (Topic-wise)
|
© EduRev
|
Education Revolution
|


|


