Class 9 Exam  >  Class 9 Tests  >  Mathematics (Maths) Class 9  >  Test: Statistics- 1 - Class 9 MCQ

Test: Statistics- 1 - Class 9 MCQ


Test Description

25 Questions MCQ Test Mathematics (Maths) Class 9 - Test: Statistics- 1

Test: Statistics- 1 for Class 9 2024 is part of Mathematics (Maths) Class 9 preparation. The Test: Statistics- 1 questions and answers have been prepared according to the Class 9 exam syllabus.The Test: Statistics- 1 MCQs are made for Class 9 2024 Exam. Find important definitions, questions, notes, meanings, examples, exercises, MCQs and online tests for Test: Statistics- 1 below.
Solutions of Test: Statistics- 1 questions in English are available as part of our Mathematics (Maths) Class 9 for Class 9 & Test: Statistics- 1 solutions in Hindi for Mathematics (Maths) Class 9 course. Download more important topics, notes, lectures and mock test series for Class 9 Exam by signing up for free. Attempt Test: Statistics- 1 | 25 questions in 25 minutes | Mock test for Class 9 preparation | Free important questions MCQ to study Mathematics (Maths) Class 9 for Class 9 Exam | Download free PDF with solutions
Test: Statistics- 1 - Question 1

A student collects information about the number of school going children in a locality consisting of a hundred households. The data collected by him is

Test: Statistics- 1 - Question 2

Class mark of a particular class is 9.5 and the class size is 6, then the class interval is

Detailed Solution for Test: Statistics- 1 - Question 2
- Class Mark Formula: \((\text{Lower limit} + \text{Upper limit}) / 2 = 9.5\)
- Class Size: \(\text{Upper limit} - \text{Lower limit} = 6\)
- Calculations:
- \(L + U = 19\)
- \(U - L = 6\)
- Solving gives \(U = 12.5\) and \(L = 6.5\)
- Class Interval: 6.5-12.5
1 Crore+ students have signed up on EduRev. Have you? Download the App
Test: Statistics- 1 - Question 3

One of the sides of a frequency polygon is

Detailed Solution for Test: Statistics- 1 - Question 3

The x-axis is one of the sides of a frequency polygon. The x-axis represents the values of the variable being measured.

Test: Statistics- 1 - Question 4

Out of sixteen observations arranged in an ascending order, the 8th and 9th observations are 25 and 27. Then, the median is

Detailed Solution for Test: Statistics- 1 - Question 4
- Total number of observations is 16, which is even.
- The median is the average of the 8th and 9th observations.
- Given the 8th observation is 25 and the 9th is 27.
- Calculation: (25 + 27) / 2 = 26

Answer: 26
Test: Statistics- 1 - Question 5

Vihaan has marks of 92, 85, and 78 in three mathematics tests. In order to have an average of exactly 87 for the four math tests, he should obtain

Detailed Solution for Test: Statistics- 1 - Question 5
To find the marks Vihaan needs in the fourth test:
- Calculate the total marks required for an average of 87 over four tests:
- Total marks = Average × Number of tests = 87 × 4 = 348.
- Calculate the sum of his current marks:
- Current total = 92 + 85 + 78 = 255.
- Determine the marks needed in the fourth test:
- Marks needed = Total marks required - Current total = 348 - 255 = 93.
Thus, Vihaan should obtain 93 marks in his fourth test to achieve an average of 87.
Test: Statistics- 1 - Question 6

To analyse the election results, the data is collected from a newspapers. The data thus collected is known as

Test: Statistics- 1 - Question 7

The class size of a distribution is 25 and the first class interval is 200-224. Then, the class marks of first two class intervals are

Detailed Solution for Test: Statistics- 1 - Question 7

class mark of 1st interval=212

class mark of 2nd interval=236.5

Step-by-step explanation:

First Class interval=200-224

class mark=upper limit +lower limit divided by 2..

class mark of first interval is =200+224 divided by 2=212

Second class interval=224-249

class mark of second interval =224 +249 divided by 2

answer= 236.5

Test: Statistics- 1 - Question 8

Which of the following is NOT a common measure of central tendency?

Test: Statistics- 1 - Question 9

What is the median of the data 78, 56, 22, 34, 45, 54, 39, 68, 54, 84?        

Test: Statistics- 1 - Question 10

If the mean of x and 1/x is M, then the mean of x2 and 

Detailed Solution for Test: Statistics- 1 - Question 10

If the mean of x and 1/2 is M. then the mean of

x² and 1/x² is

Mean of x and 1/x is M. So

( x +1/x)/2=M

Squaring on both sides,

(x +1/x)²/2²=M²

(x² + 1/x²+2*x*1/x)/4=M²

x²+1/x²+2=4 m²

x²+ 1/x²=4m²-2

Dividing by 2 on both sides,

(x²+1/x²)/2=(4m²-2)/2

= (x²+1/x²)/2 =2 *(2m²-1)/2=2m²-1

=Mean of x² and 1/x²=(2m²-1)

Test: Statistics- 1 - Question 11

Which of the following variables are discrete ? 1. Size of shoes, 2. Number of pages in a book, 3. Distance travelled by a train, 4. Time

Test: Statistics- 1 - Question 12

In a frequency distribution, the mid-value of a class is 60.5 and the width of the class is 10. The lower limit of the class is

Test: Statistics- 1 - Question 13

The mean for counting numbers through 100 is

Test: Statistics- 1 - Question 14

Mode of a set of observations is the value which

Test: Statistics- 1 - Question 15

The mean of six numbers is 23. If one of the numbers is excluded, the mean of the remaining numbers becomes 20. The excluded number is

Test: Statistics- 1 - Question 16

For a given data, the difference between the maximum and minimum observation is known as its

Test: Statistics- 1 - Question 17

The width of each of five continuous classes in a frequency distribution is 5 and the lower class limit of the lowest class is 10. The upper class limit of the highest class is

Detailed Solution for Test: Statistics- 1 - Question 17

Let x and y be the upper and lower class limit of frequency distribution.
Given, width of the class = 5
⇒ x-y= 5 …(i)
Also, given lower class (y) = 10 On putting y = 10 in Eq. (i), we get
x – 10= 5 ⇒  x = 15 So, the upper class limit of the lowest class is 15.
Hence, the upper class limit of the highest class
=(Number of continuous classes x Class width + Lower class limit of the lowest class)
= 5 x 5+10 = 25+10=35
Hence,’the upper class limit of the highest class is 35.
Alternate Method
After finding the upper class limit of the lowest class, the five continuous classes in a frequency distribution with width 5 are 10-15,15-20, 20-25, 25-30 and 30-35.
Thus, the highest class is 30-35,
Hence, the upper limit of this class is 35.

Test: Statistics- 1 - Question 18

The mean of first four prime numbers is

Test: Statistics- 1 - Question 19

The mode of 4, 6, 7, 8, 12, 11, 13, 9, 13, 9, 7, 8, 9 is

Test: Statistics- 1 - Question 20

The mean of five observations is 15. If the mean of first three observations is 14 and that of last three is 17, then the third observation is

Detailed Solution for Test: Statistics- 1 - Question 20

⇒  It is given that Mean of 5 observations is 15.

∴  The sum of observations =15×5=75.

∴  It is given that mean of the first 3 observations is 14.

∴  The sum of first three observations =14×3=42.

⇒  Given that mean of the last 3 observations is 17.

∴  The sum of the last three observations =17×3=51

∴  The third observation =(42+51)−75
 =93−75

=18

Test: Statistics- 1 - Question 21

In an examination, ten students scored the following marks: 60, 58, 90, 51, 47, 81, 70, 95, 87, 99. The range of this data is

Test: Statistics- 1 - Question 22

In a bar graph, 0.25 cm length of a bar represents 100 people. Then, the length of bar which represents 2000 people is

Test: Statistics- 1 - Question 23

If, for the set of observations 4, 7, x, 8, 9, 10 the mean is 8, then x is equal to

Test: Statistics- 1 - Question 24

A set of data consists of six numbers: 7, 8, 8, 9, 9 and x. The difference between the modes when x = 9 and x = 8 is

Detailed Solution for Test: Statistics- 1 - Question 24
It is not the matter of value of x .since modes are 9 and 8 .therefore difference will remain same i.e 1
Test: Statistics- 1 - Question 25

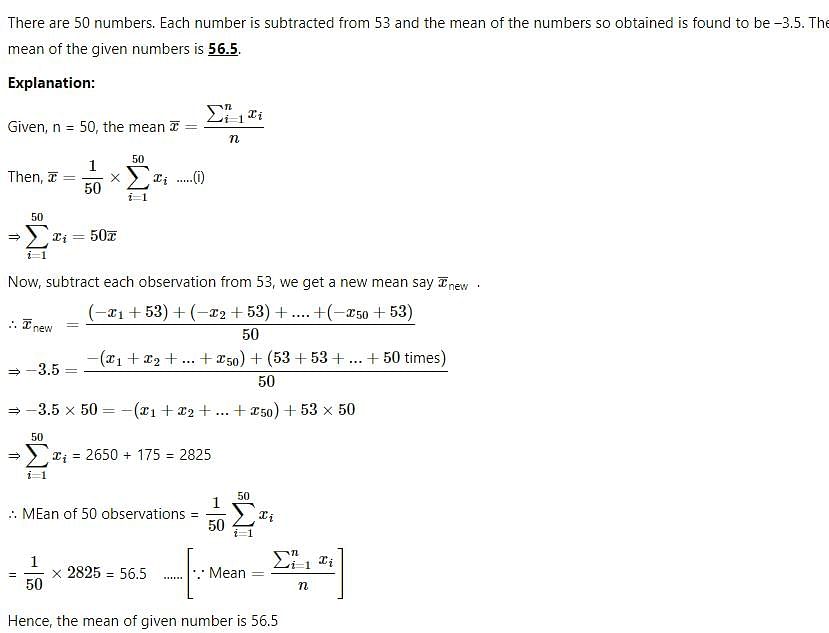
There are 50 numbers. Each number is subtracted from 53 and the mean of the numbers so obtained is found to be – 3.5. The mean of the given number is

Detailed Solution for Test: Statistics- 1 - Question 25

44 videos|412 docs|55 tests
Information about Test: Statistics- 1 Page
In this test you can find the Exam questions for Test: Statistics- 1 solved & explained in the simplest way possible. Besides giving Questions and answers for Test: Statistics- 1, EduRev gives you an ample number of Online tests for practice

Top Courses for Class 9

44 videos|412 docs|55 tests
Download as PDF

Top Courses for Class 9