Case Based Questions Test: Statistics - Class 10 MCQ
15 Questions MCQ Test - Case Based Questions Test: Statistics
Read the following text and answer the following questions on the basis of the same.
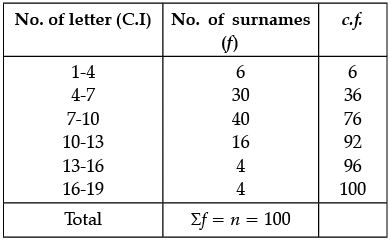
100 surnames were randomly picked up from a local telephone directory and the frequency distribution of the number of letters in the English alphabets in the surnames was obtained as follows:

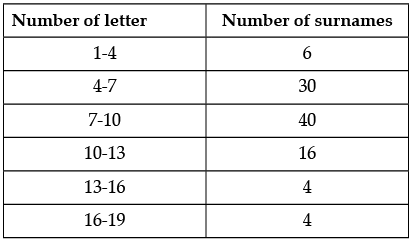
Q. Determine the median number of letters in the surnames.


Read the following text and answer the following questions on the basis of the same.
100 surnames were randomly picked up from a local telephone directory and the frequency distribution of the number of letters in the English alphabets in the surnames was obtained as follows:

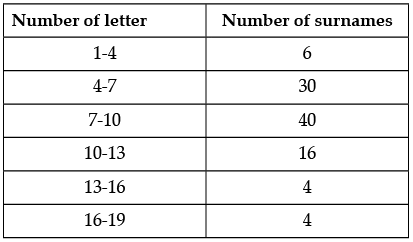
Q. Sum of lower limit of median and modal class is:


| 1 Crore+ students have signed up on EduRev. Have you? Download the App |
Read the following text and answer the following questions on the basis of the same.
100 surnames were randomly picked up from a local telephone directory and the frequency distribution of the number of letters in the English alphabets in the surnames was obtained as follows:

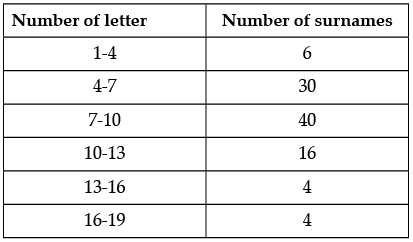
Q. What is the upper limit of median class?


Read the following text and answer the following questions on the basis of the same.
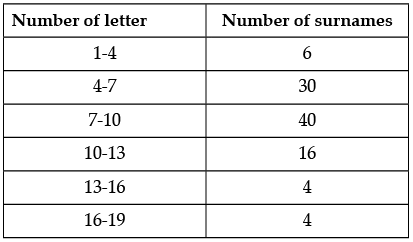
100 surnames were randomly picked up from a local telephone directory and the frequency distribution of the number of letters in the English alphabets in the surnames was obtained as follows:

Read the following text and answer the following questions on the basis of the same.
100 surnames were randomly picked up from a local telephone directory and the frequency distribution of the number of letters in the English alphabets in the surnames was obtained as follows:

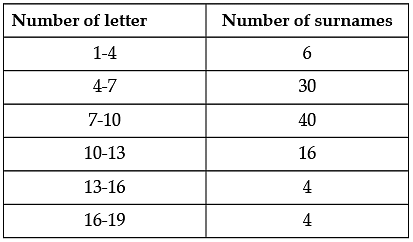
Q. Cumulative frequency of median class:
Read the following text and answer the following questions on the basis of the same.
Electricity Consumption problem

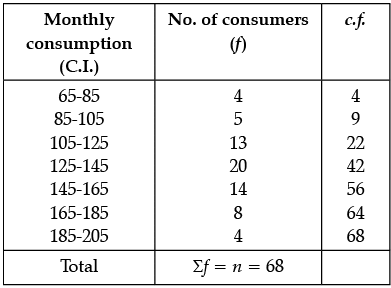
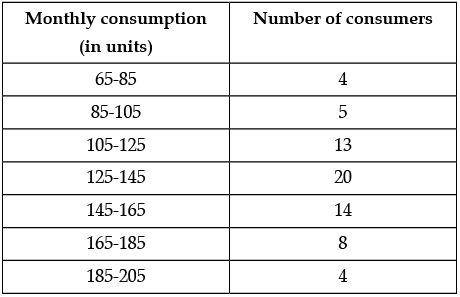
The following frequency distribution gives the monthly consumption of consumers of a locality.
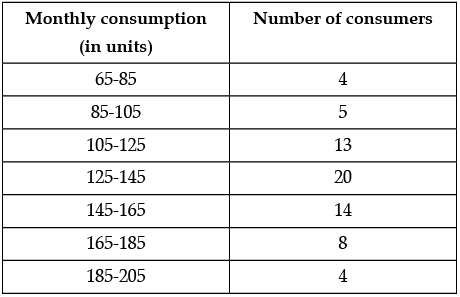
Q. What is the lower limit of modal class?
Read the following text and answer the following questions on the basis of the same.
Electricity Consumption problem

The following frequency distribution gives the monthly consumption of consumers of a locality.
Read the following text and answer the following questions on the basis of the same.
Electricity Consumption problem

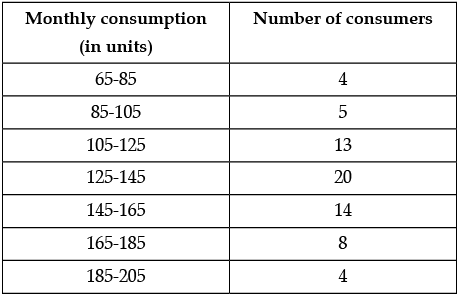
The following frequency distribution gives the monthly consumption of consumers of a locality.
Read the following text and answer the following questions on the basis of the same.
Electricity Consumption problem

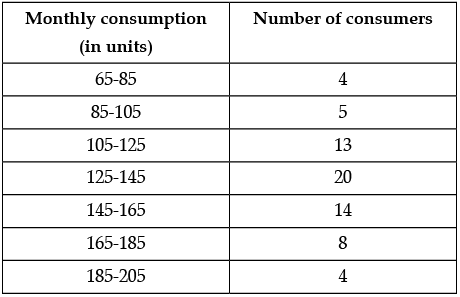
The following frequency distribution gives the monthly consumption of consumers of a locality.
Read the following text and answer the following questions on the basis of the same.
Electricity Consumption problem

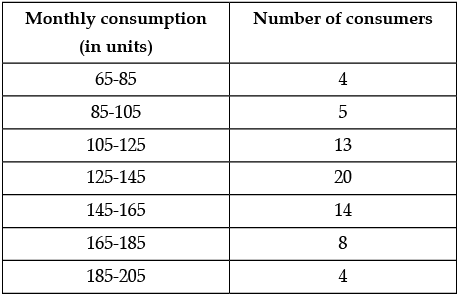
The following frequency distribution gives the monthly consumption of consumers of a locality.
Read the following text and answer the following questions on the basis of the same.
The Covid–19Pandemic, also known as coronavirus pandemic, is an ongoing pandemic of coronavirus disease caused by the transmission of severe acute respiratory syndrome Coronavirus 2 (SARS – Cov - 2) among humans.
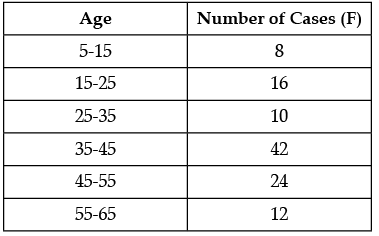
The following table shows the age distribution of case admitted during a day in two different hospitals.
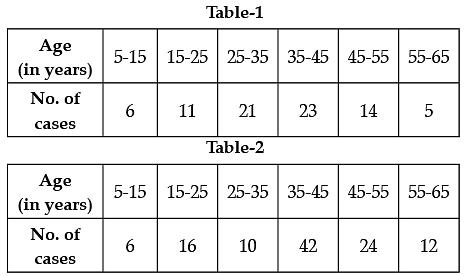
Refer to Table 1
Q. The upper limit of modal class is
Read the following text and answer the following questions on the basis of the same.
The Covid–19Pandemic, also known as coronavirus pandemic, is an ongoing pandemic of coronavirus disease caused by the transmission of severe acute respiratory syndrome Coronavirus 2 (SARS – Cov - 2) among humans.
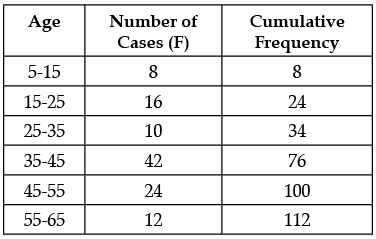
The following table shows the age distribution of case admitted during a day in two different hospitals.
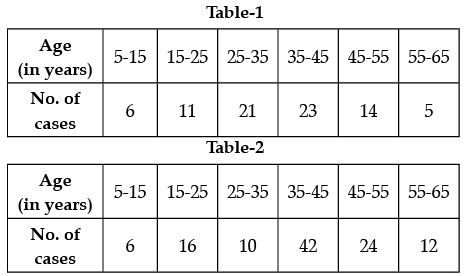
Refer to Table 2
Q. The mode of given data isRead the following text and answer the following questions on the basis of the same.
The Covid–19Pandemic, also known as coronavirus pandemic, is an ongoing pandemic of coronavirus disease caused by the transmission of severe acute respiratory syndrome Coronavirus 2 (SARS – Cov - 2) among humans.
The following table shows the age distribution of case admitted during a day in two different hospitals.
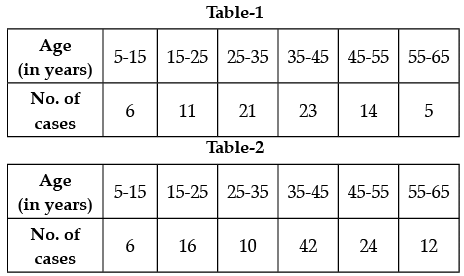
Refer to Table 1
Q.The average age for which maximum cases occurred isRead the following text and answer the following questions on the basis of the same.
The Covid–19Pandemic, also known as coronavirus pandemic, is an ongoing pandemic of coronavirus disease caused by the transmission of severe acute respiratory syndrome Coronavirus 2 (SARS – Cov - 2) among humans.
The following table shows the age distribution of case admitted during a day in two different hospitals.
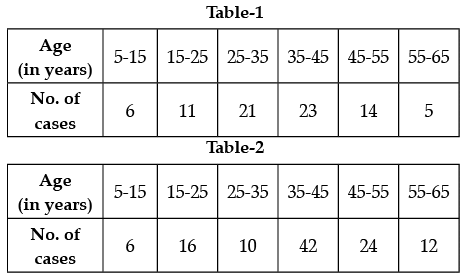
Refer to Table 1
Q. The mean of the given data isRead the following text and answer the following questions on the basis of the same.
The Covid–19Pandemic, also known as coronavirus pandemic, is an ongoing pandemic of coronavirus disease caused by the transmission of severe acute respiratory syndrome Coronavirus 2 (SARS – Cov - 2) among humans.
The following table shows the age distribution of case admitted during a day in two different hospitals.
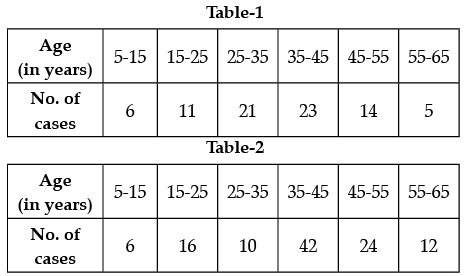
Refer to Table 2
Q. Median of given data is


