RS Aggarwal Test: Statistics - Class 10 MCQ
25 Questions MCQ Test Mathematics (Maths) Class 10 - RS Aggarwal Test: Statistics
Which of the following is a measure of central tendency?
| 1 Crore+ students have signed up on EduRev. Have you? Download the App |
The mean of the following data 12, 22, 32,.......n2 is –
The mean of the following data is 18.75 then the value of p is –
Which of the following can not be determined graphically –
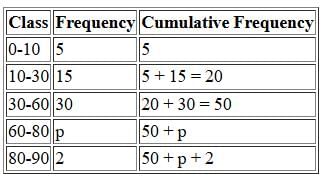
If the median of the following data is 40 then the value of p is –
In the formula for mode of a grouped data, mode = where symbols have their usual meaning f0 represents :
Median of a given frequency distribution is found with the help of a –
The measure of central tendency which is given by the x-coordinate of the point of intersection of the 'more than' ogive and 'less than' ogive is –
The marks obtained by 9 students in Mathematics are 59, 46, 31, 23, 27, 40, 52, 35 and 29. The mean of the data is
The marks obtained by 9 students in Mathematics are 59, 46, 31, 23, 27, 44, 52, 40 and 29. The mean of the data is
The arithmetic mean of a set of 40 values is 65. If each of the 40 values is increased by 5, what will be the mean of the set of new values:
The mean of 25 observations is 36. If the mean of first 13 observations is 32 and that of the last 13 observations is 39, then the 13th observation is
|
126 videos|457 docs|75 tests
|
|
126 videos|457 docs|75 tests
|


 =342/9=38


 351/9=39


