Test: Relations & Functions- Case Based Type Questions - Commerce MCQ
10 Questions MCQ Test Mathematics (Maths) Class 11 - Test: Relations & Functions- Case Based Type Questions

A Relation R from A to B can be depicted pictorially using arrow diagram. In arrow diagram, we write down the elements of two sets A and B in two disjoint circles. Then we draw arrow from set A to set B whenever (a, b) ∈ R. An example of information depicted through an arrow diagram is shown below. For example:
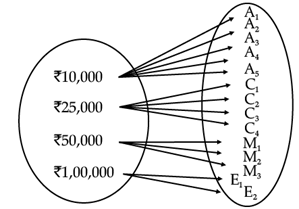
A company has four categories of employees given by Assistants (A), Clerks (C), Managers (M) and an Executive Officer (E). The company provides ₹10,000, ₹25,000, ₹50,000 and ₹1,00,000 as salaries to the people who work in the categories A, C, M and E respectively. Here A1, A2, A3, A4 and A5 are Assistants; C1, C2, C3, C4 are Clerks; M1, M2, M3 are Managers and E1, E2 are Executive Officers then the relation R is defined by xRy, where x is the salary given to person y.

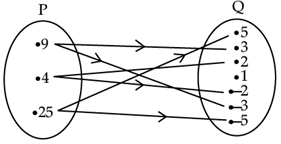
The relation defined in the above arrow diagram from set P to set Q is
The relation defined in the above arrow diagram from set P to set Q is
A Relation R from A to B can be depicted pictorially using arrow diagram. In arrow diagram, we write down the elements of two sets A and B in two disjoint circles. Then we draw arrow from set A to set B whenever (a, b) ∈ R. An example of information depicted through an arrow diagram is shown below. For example:
A company has four categories of employees given by Assistants (A), Clerks (C), Managers (M) and an Executive Officer (E). The company provides ₹10,000, ₹25,000, ₹50,000 and ₹1,00,000 as salaries to the people who work in the categories A, C, M and E respectively. Here A1, A2, A3, A4 and A5 are Assistants; C1, C2, C3, C4 are Clerks; M1, M2, M3 are Managers and E1, E2 are Executive Officers then the relation R is defined by xRy, where x is the salary given to person y.
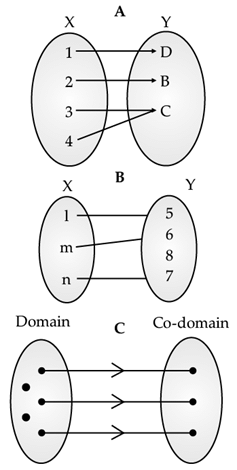
Which among the above figures shows a Relation between the two non - empty sets?
Which among the above figures shows a Relation between the two non - empty sets?
| 1 Crore+ students have signed up on EduRev. Have you? Download the App |
A Relation R from A to B can be depicted pictorially using arrow diagram. In arrow diagram, we write down the elements of two sets A and B in two disjoint circles. Then we draw arrow from set A to set B whenever (a, b) ∈ R. An example of information depicted through an arrow diagram is shown below. For example:
A company has four categories of employees given by Assistants (A), Clerks (C), Managers (M) and an Executive Officer (E). The company provides ₹10,000, ₹25,000, ₹50,000 and ₹1,00,000 as salaries to the people who work in the categories A, C, M and E respectively. Here A1, A2, A3, A4 and A5 are Assistants; C1, C2, C3, C4 are Clerks; M1, M2, M3 are Managers and E1, E2 are Executive Officers then the relation R is defined by xRy, where x is the salary given to person y.

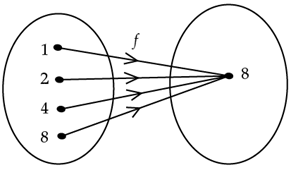
The relation defined in the above arrow diagram from set A to set B is
The relation defined in the above arrow diagram from set A to set B is
A Relation R from A to B can be depicted pictorially using arrow diagram. In arrow diagram, we write down the elements of two sets A and B in two disjoint circles. Then we draw arrow from set A to set B whenever (a, b) ∈ R. An example of information depicted through an arrow diagram is shown below. For example:
A company has four categories of employees given by Assistants (A), Clerks (C), Managers (M) and an Executive Officer (E). The company provides ₹10,000, ₹25,000, ₹50,000 and ₹1,00,000 as salaries to the people who work in the categories A, C, M and E respectively. Here A1, A2, A3, A4 and A5 are Assistants; C1, C2, C3, C4 are Clerks; M1, M2, M3 are Managers and E1, E2 are Executive Officers then the relation R is defined by xRy, where x is the salary given to person y.

If the number of elements in set A and set B are p and q, then the number of relations from A to B are
A Relation R from A to B can be depicted pictorially using arrow diagram. In arrow diagram, we write down the elements of two sets A and B in two disjoint circles. Then we draw arrow from set A to set B whenever (a, b) ∈ R. An example of information depicted through an arrow diagram is shown below. For example:
A company has four categories of employees given by Assistants (A), Clerks (C), Managers (M) and an Executive Officer (E). The company provides ₹10,000, ₹25,000, ₹50,000 and ₹1,00,000 as salaries to the people who work in the categories A, C, M and E respectively. Here A1, A2, A3, A4 and A5 are Assistants; C1, C2, C3, C4 are Clerks; M1, M2, M3 are Managers and E1, E2 are Executive Officers then the relation R is defined by xRy, where x is the salary given to person y.

If the number of elements in set A and set B are p and q then the number of functions from A to B are
Consider the graphs of the functions f(x), h(x) and g(x).


The domain of f(x) is ..................
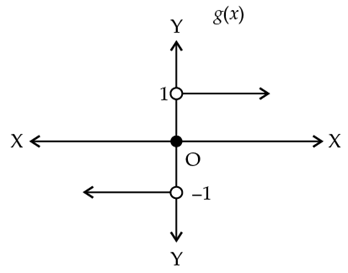
Consider the graphs of the functions f(x), h(x) and g(x).


The range of g(x) is ................
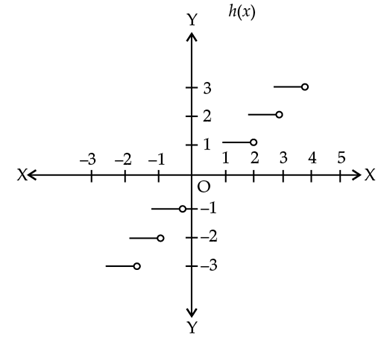
Consider the graphs of the functions f(x), h(x) and g(x).


The range of h(x) is .......................
Consider the graphs of the functions f(x), h(x) and g(x).

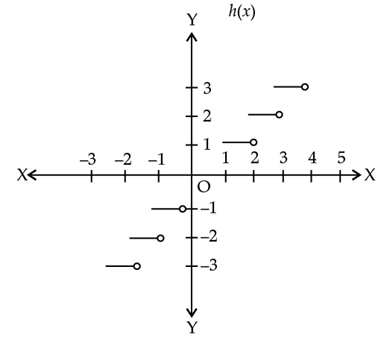
The value of h(–2.3) is ...................
Consider the graphs of the functions f(x), h(x) and g(x).
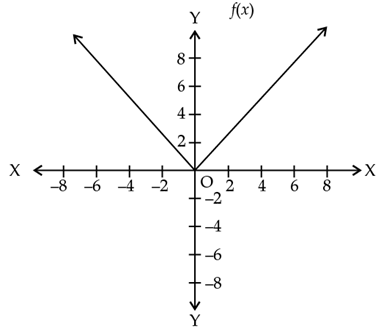

The value of f(10) is ...................
|
75 videos|238 docs|91 tests
|
|
75 videos|238 docs|91 tests
|
Top Courses for Commerce


Important Questions for Relations & Functions- Case Based Type Questions
Relations & Functions- Case Based Type Questions MCQs with Answers
Online Tests for Relations & Functions- Case Based Type Questions Mathematics (Maths) Class 11
|
© EduRev
|
Education Revolution
|


|


