Test: Graph Interpretation- 1 - GMAT MCQ
10 Questions MCQ Test Data Insights for GMAT - Test: Graph Interpretation- 1
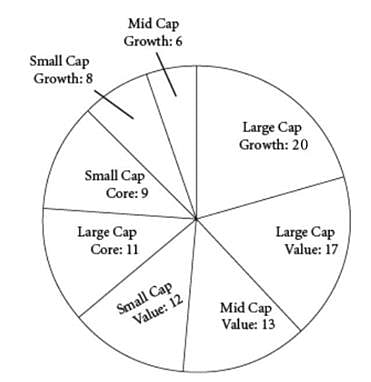
The chart shows the breakdown of the stock holdings in one investor’s portfolio, by number of company stocks held, each company’s market capitalization type (Large, Mid, or Small), and the type of stock (Growth, Core, or Value).
Q. Based on the given information, fill in the blanks in each of the following statements.
1. The Growth stocks in the investor’s portfolio represent ______ % of the total portfolio.
2. The investor has ______ times as many Large Cap stocks in her portfolio as Small Cap stocks.

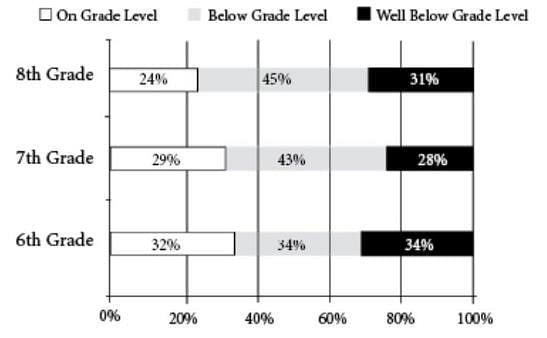
Springfield Middle School has 600 students in total, 200 in each class. The graph shows the percentage of students in each grade who do or do not read on grade level.
Q. Based on the given information, fill in the blanks in each of the following statements.
1. The total number of 7th-grade students who do not read on grade level is ______
2. If a Springfield middle school student is selected at random, there is a _______ probability that he or she reads on grade level.
| 1 Crore+ students have signed up on EduRev. Have you? Download the App |
The graph shows the stock price and the earnings per share for a number of companies in the same sector. A company’s price-to-earnings (P/E) ratio is the ratio of the company’s stock price to the company’s earnings per share.
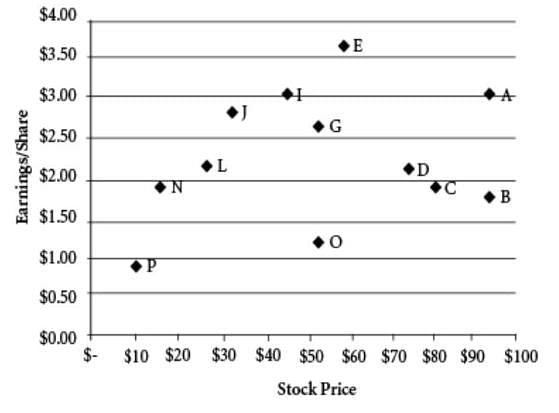
Q. Based on the given information, fill in the blanks in each of the following statements.
1. Of the companies whose stock price is greater than $60, ____have a P/E ratio greater than 40.
2. The number of companies that have a P/E ratio less than 10 is_____.

Q. Based on the given information, fill in the blanks in each of the following statements.
The graph shows a family’s monthly electricity consumption, in kWh, over the course of two years.
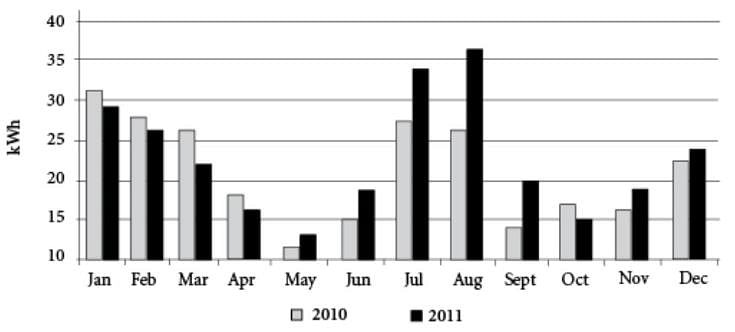
Q. Based on the given information, fill in the blanks in each of the following statements.
1. The family’s electricity consumption in January 2011 was approximately ____% of its consumption in December 2010.
2. If the family paid a constant rate of $x per kWh between June 2010 and November 2010, inclusive, then it paid _____as much between June 2010 and August 2010, inclusive, as it did between September 2010 and November 2010, inclusive.
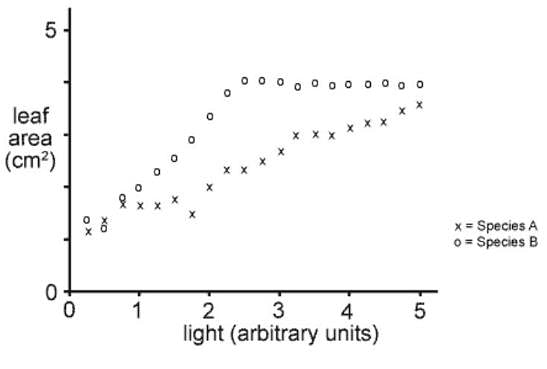
Q. The graph shows the results of an investigation to determine the relationship (if any) between leaf area and exposure to light for two species of plant. The plants were grown under identical conditions apart from the light intensity to which they were exposed. The points on the graph represent the average leaf areas for twenty full-grown leaves at each level of light exposure.
1. A scientist could best conclude that for Species A there is ____ correlation between leaf area and light intensity.
2. The light intensity that apparently results in the greatest difference in leaf areas between the two species is _____ units.
Rural Economy in Central America - 2000
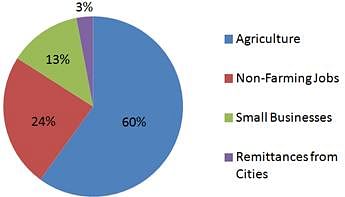
Rural Economy in Central America - 2010
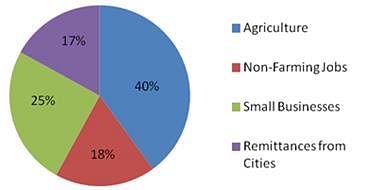
The above pie charts give the percentages of the rural economy in a Central American country for the years 2000 and 2010.
Q. The change in the overall earnings for non-farming jobs plus small businesses between 2000 and 2010
Rural Economy in Central America - 2000
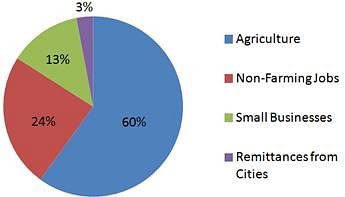
Rural Economy in Central America - 2010
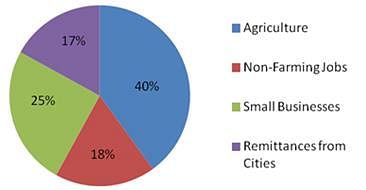
The above pie charts give the percentages of the rural economy in a Central American country for the years 2000 and 2010.
Q. The smallest proportional change in percent between 2000 and 2010 in any segment of the rural economy was in
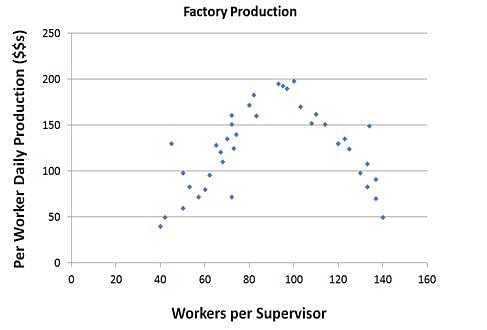
Q. Assuming the trend in the graph stays the same over the range of workers per supervisor values, if the company were to employ 30 workers per supervisor they would likely be __________ productive than if the company were to employ 160 workers per supervisor.
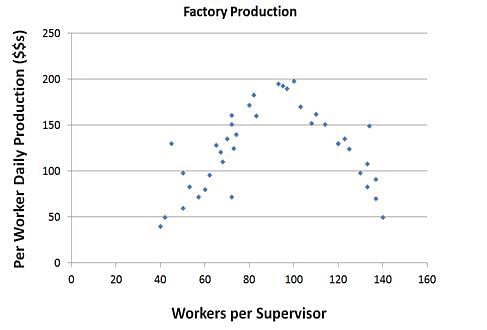
Q. If it wanted to increase productivity, a company currently employing 115 workers per supervisor should consider
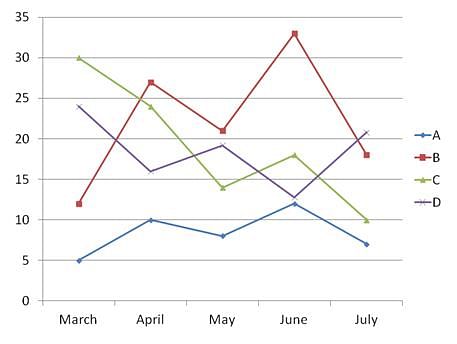
The above graph gives the values for 4 items measured by the police department. One represents the number of crimes reported, one represents the number of arrests made, one represents the number of police officers on staff, and one represents the budget surplus for the department (in $1000s).
Q. If the impact of a change enacted by the police department takes a month to register, then we can identify a negative linear relationship between B and
|
17 videos|19 docs|13 tests
|


 )
)


