Test: Traffic Engineering- 2 - Civil Engineering (CE) MCQ
20 Questions MCQ Test Transportation Engineering - Test: Traffic Engineering- 2

Which one of the following diagrams illustrates the relation between speed 'u' and density 'k' of traffic flow?
Which one of the following methods of O-D traffic surveys is conducted for comprehensive analysis of traffic and transportation data?
| 1 Crore+ students have signed up on EduRev. Have you? Download the App |
The lost time due to starting delay on a traffic signal is noted to be 3s, the actual green time is 25s and yellow time is 3s. How much is the effective green time?
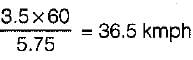
In speed and delay study, if the average journey time on a stretch of road length of 3.5 km is 7.55 minutes and the average stopped delay is 1.8 minutes, the average running speed will be, nearly
If L is the length of vehicle in meters, C is the clear distance between two consecutive vehicles (Stopping sight distance), V is the speed of vehicles in km/hour; then the maximum number (N) of vehicles/hour is equal to

When the speed of the traffic flow becomes zero, then
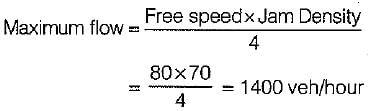
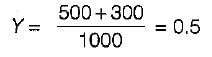
It was noted that on a section of road, the free speed was 80 kmph and the jam density was 70 vpkm. The maximum flow in vph that could be expected on this road is
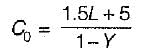
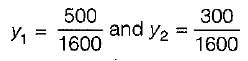
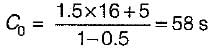
If the normal flows on two approach roads at an intersection are respectively 500 pcu per hr and 300 pcu per hr, the saturation flows are 1600 pcu per hr on each road and the total lost time per signal cycle is 16 s, then the optimum cycle time by Webster’s method is
When two roads with two-lane, two-way traffic, cross at an uncontrolled intersection, the total number of potential major conflict points would be
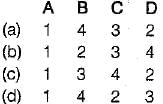
Matching List-I (Traffic flow characteristics) with Llst-ll (Figure/symbol) and select the correct answer using the codes given below the lists:
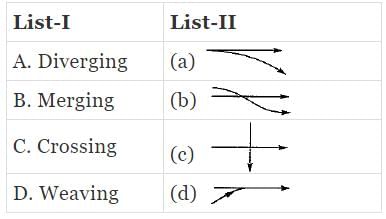
Codes:
The traffic conflicts that may occur in a rotary intersection are
In which of the following traffic signal system are the cycle length and cycle division are automatically varied?
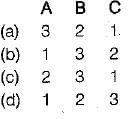
Matching List-I with List-Il and select the correct answer using the codes given below the lists: 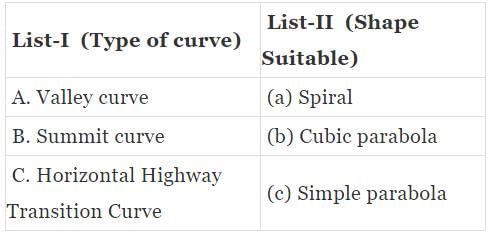
Codes:
With increase in speed of the traffic stream, the maximum capacity of the lane
When a number of roads are meeting at a point and only one of the roads is important, then the suitable shape of rotary is
|
26 videos|91 docs|58 tests
|
|
26 videos|91 docs|58 tests
|
Top Courses for Civil Engineering (CE)


Important Questions for Traffic Engineering- 2
Traffic Engineering- 2 MCQs with Answers
Online Tests for Traffic Engineering- 2 Transportation Engineering
|
© EduRev
|
Education Revolution
|


|


