Prepare for Data & Analytics
with EduRev
Data & Analytics syllabus


All Courses for Data & Analytics


What is Data Analytics? A Complete Guide for Beginners
Data analytics is one of the most in-demand skills in today's job market, and for good reason. At its core, data analytics refers to the process of examining, cleaning, transforming, and modeling data to discover useful information, draw meaningful conclusions, and support smarter decision-making. Whether you are a working professional looking to upskill or a fresh graduate trying to enter the tech industry, understanding data and analytics is your first step.
There are four main types of data analytics that every beginner should know:
- Descriptive Analytics - Summarises what happened in the past
- Diagnostic Analytics - Explains why something happened
- Predictive Analytics - Forecasts what might happen next
- Prescriptive Analytics - Recommends actions to achieve desired outcomes
If you are just starting out, the What is Data Analytics? course on EduRev gives you a solid foundation before diving into tools and techniques.
Best Data Analytics Courses to Build Job-Ready Skills
With hundreds of resources available, choosing the right data analytics course can feel overwhelming. The good news is that EduRev offers structured, beginner-friendly courses that cover everything from foundational concepts to advanced tools used by working professionals.
Here is a quick overview of top courses to consider in 2025:
| Course | Best For | Skill Level |
|---|---|---|
| What is Data Analytics? | Absolute beginners | Beginner |
| Big Data & Analysis Tutorial | Understanding large datasets | Beginner-Intermediate |
| SPSS for Beginners | Statistical analysis | Beginner |
| Weka Tutorial | Data mining & machine learning | Beginner-Intermediate |
| StatCrunch Tutorials | Web-based statistics | Beginner |
Each of these courses is designed to help you become job-ready and build a strong analytics portfolio step by step.
How to Learn Google Analytics: Beginner to Advanced Overview
Google Analytics is arguably the most widely used web analytics tool in the world, and learning it can significantly boost your employability. Google Analytics 4 (GA4), which replaced Universal Analytics in July 2023, is event-based rather than session-based - making it more flexible for tracking user behaviour across both websites and mobile apps.
GA4 also integrates natively with Google Ads and BigQuery, enabling advanced analysis for marketing professionals and developers alike. If you are aiming for a Google Analytics certification, Google provides one through its Skillshop platform at no cost.
EduRev has structured the learning path into three focused courses:
- Google Analytics for Beginners - Ideal for those with zero prior experience
- Google Analytics for Developers - Covers implementation, custom events, and API usage
- Mobile App Analytics Fundamentals - Focused on tracking app-based user behaviour
Whether your goal is a best google analytics course for marketing or development, these resources cover the complete journey from setup to advanced reporting.
Introduction to Big Data Analysis: Key Concepts You Must Know
Big data refers to datasets so large and complex that traditional data processing tools struggle to handle them. Understanding big data analytics is essential for anyone aspiring to work in fields like finance, e-commerce, healthcare, or logistics in India.
Key concepts every learner must be familiar with include:
- The 3 Vs of Big Data: Volume, Velocity, and Variety
- Distributed computing frameworks such as Hadoop and Spark
- Data pipelines and ETL (Extract, Transform, Load) processes
- Real-time versus batch data processing
Start your journey with the Big Data & Analysis Tutorial: Introduction on EduRev, which covers these foundational ideas in a clear, structured manner suited for beginners.
Top Data Analytics Tools Used by Professionals
Knowing the right data analytics tools can set you apart in today's competitive job market. Professionals across industries rely on a mix of statistical software, visualisation platforms, and programming languages to derive insights from data.
| Tool | Primary Use | Best For |
|---|---|---|
| Google Analytics | Web & app tracking | Marketers, developers |
| IBM SPSS | Statistical analysis | Researchers, social scientists |
| Weka | Data mining, ML | Academic researchers |
| StatCrunch | Web-based statistics | Students, educators |
| ArcGIS | Geospatial analysis | Urban planners, scientists |
The best data analytics software for you depends on your domain. Most Indian companies hiring data analysts in 2025 expect familiarity with at least two or three of these tools.
How to Use SPSS for Data Analysis: A Beginner's Overview
IBM SPSS (Statistical Package for the Social Sciences) is one of the most trusted statistical analysis tools used in social science research, healthcare, education, and business. Developed and maintained by IBM, it is available in both desktop and cloud-based versions.
For Indian students pursuing research-oriented careers or postgraduate programmes, SPSS is frequently encountered in academic settings. Key tasks you can perform with SPSS include:
- Descriptive statistics and frequency analysis
- Regression and correlation analysis
- Hypothesis testing (t-tests, ANOVA)
- Predictive modelling and data transformation
To learn SPSS online, the SPSS for Beginners course on EduRev is an excellent starting point, walking you through the interface and core analytical functions step by step.
GIS and ArcGIS Explained: What They Are and How to Get Started
Geographic Information Systems (GIS) allow analysts to visualise, interpret, and understand spatial data. ArcGIS, developed by Esri and headquartered in Redlands, California, is the industry-leading GIS platform. Its product suite includes ArcGIS Pro, ArcGIS Online, and ArcGIS Enterprise.
GIS technology is actively applied in urban planning, environmental science, transportation management, disaster response, and public health - all highly relevant sectors in India's growing smart city and infrastructure initiatives.
Ready to get started? The Way to Learning GIS and ArcGIS course on EduRev covers everything from basic mapping concepts to practical ArcGIS workflows, making it ideal for beginners with no prior GIS experience.
Weka and StatCrunch: Essential Tools for Data Mining and Statistics
Weka (Waikato Environment for Knowledge Analysis) is a free, open-source collection of machine learning algorithms developed at the University of Waikato, New Zealand. Written in Java, it supports classification, regression, clustering, association rules, and data visualisation - making it highly popular in academic and research settings globally.
If you are exploring Weka for data mining or machine learning projects, the Weka Tutorial on EduRev covers the essential workflows you need to get hands-on with real datasets.
StatCrunch, on the other hand, is a web-based statistical software integrated with Pearson's educational platforms. It is widely used in college-level statistics courses and allows users to perform data analysis and generate graphical summaries entirely online - no installation required.
Explore the StatCrunch Tutorials for Beginners on EduRev to learn how to use StatCrunch for statistical computations, charts, and data summaries effectively.
Business Analytics with Brightpearl and SAGE 100: What You Need to Know
Data analytics is not limited to technology roles. Business analytics tools like Brightpearl and SAGE 100 are increasingly important for professionals in retail, accounting, and operations management.
Brightpearl is a cloud-based retail operations platform that combines inventory management, order management, accounting, and reporting in a single system. It is primarily used by retail and wholesale businesses to streamline their operations and financial data.
- Using Brightpearl: Accounting and Bookkeeping - Learn how to manage financial records and reports
- Using Brightpearl: Product Management - Understand inventory and catalogue management workflows
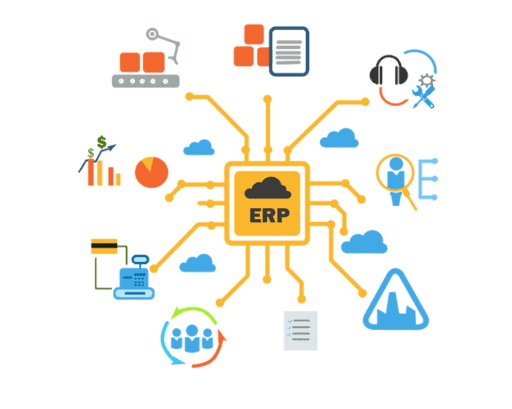
SAGE 100 (formerly MAS 90 and MAS 200) is an ERP and accounting software solution by Sage Group, designed specifically for small to mid-sized businesses. It covers accounting, inventory, payroll, and manufacturing modules. If you are working towards a career in finance or operations analytics, the detailed Guide to SAGE 100 on EduRev provides comprehensive coverage of this widely used platform.
Data Analytics Career Scope: Skills, Roles, and Opportunities
The data analytics career landscape in India is growing at a remarkable pace in 2025. Companies across sectors - from BFSI and e-commerce to healthcare and government - are actively hiring professionals with strong analytical capabilities.
Key data analyst skills employers look for include:
- Proficiency in tools like Python, R, SQL, Tableau, and Power BI
- Statistical analysis and data wrangling
- Familiarity with platforms such as Google Analytics and IBM SPSS
- Data visualisation and storytelling with data
- Business acumen to translate data insights into decisions
Popular data analytics jobs in India include Data Analyst, Business Intelligence Analyst, Marketing Analyst, Research Analyst, and Data Science Associate. Salaries for entry-level analysts in Indian metro cities typically range from ₹4 LPA to ₹8 LPA, with experienced professionals earning considerably more.
If you are wondering how to become a data analyst, the most practical path is to start with fundamentals, build proficiency in two or three key tools, and complete structured courses. EduRev offers a complete learning path - from the introductory What is Data Analytics? course all the way to advanced tool-specific tutorials - to help you build a job-ready skill set at your own pace.
Data & Analytics FAQs
| 1. What is data analytics and why do companies need it? |  |
| 2. What are the main types of data analytics I should know for exams? | |
| 3. How do I calculate mean, median and mode in data analysis? | |
| 4. What's the difference between qualitative and quantitative data? | |
| 5. How do I read and interpret charts and graphs properly? | |
| 6. What is sampling and why is it used in data collection? | |
| 7. How do I spot errors and outliers in my dataset? | |
| 8. What's the connection between correlation and causation in analytics? | |
| 9. How do I create a basic data analysis report for school projects? | |
| 10. What career options are available after studying data and analytics? | |