|
Card: 2 / 50 |
Data is a collection of facts, numbers, observations, or measurements that help us understand and convey details about the world. It enables us to draw conclusions and make informed decisions. |
|
Card: 3 / 50 |
Fill in the blank: Data visualizations such as ___ and ___ help us make sense of the information. |
|
Card: 6 / 50 |
False. Data can be represented in various forms, including text, images, and visual formats like charts and graphs. |
|
Card: 7 / 50 |
Riddle: I can be numbers, facts, or observations; I help you understand the world and make decisions. What am I? |
|
Card: 10 / 50 |
Understanding how to correctly present data and analyze it to make accurate inferences is essential. |
|
Card: 11 / 50 |
Fill in the blank: In our daily lives, we often come across various pieces of information, which we call ___. |
|
Card: 13 / 50 |
Multiple Choice: Which of the following is NOT a form of data representation? A) Tables B) Graphs C) Paintings D) Charts |
|
Card: 15 / 50 |
What is the main purpose of organizing data collected from friends about their favorite activities? |
|
Card: 16 / 50 |
To determine which activity is the most popular by making the data clearer and easier to analyze. |
|
Card: 17 / 50 |
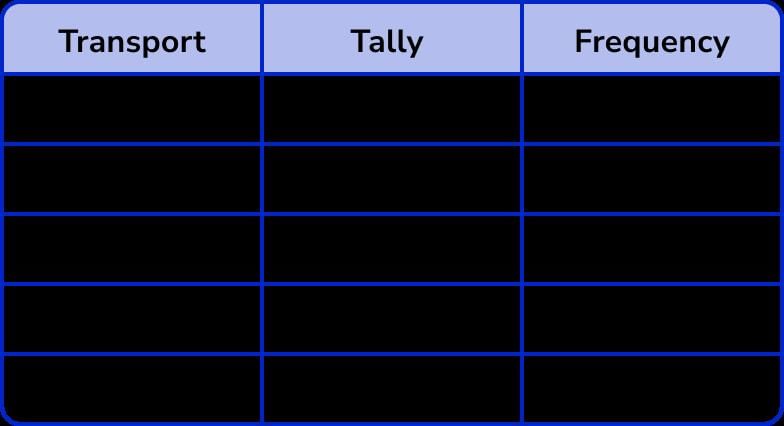
Fill in the blank: Tally marks are a quick way to count things in groups of ___ and ___ for easier counting. |
|
Card: 19 / 50 |
True or False: The activity with the most tally marks is considered the least popular. |
|
Card: 21 / 50 |
Riddle: I help you count in groups of five, with a cross for the fifth. What am I? |
|
Card: 25 / 50 |
Fill in the blank: To visualize the popularity of an activity, you could use ___ marks. |
|
Card: 27 / 50 |
Multiple Choice: Which of the following activities received the most votes? A) Magic Show B) Dance-Off C) Treasure Hunt D) None of the above |
|
Card: 30 / 50 |
Tally marks are grouped in sets of five, with four vertical lines and a diagonal line crossing them for the fifth count. |
|
Card: 31 / 50 |
What is the purpose of organizing data, such as shoe sizes, in a systematic way? |
|
Card: 32 / 50 |
Organizing data allows for easier visualization and understanding of patterns, such as identifying which shoe size is the most common. |
|
Card: 35 / 50 |
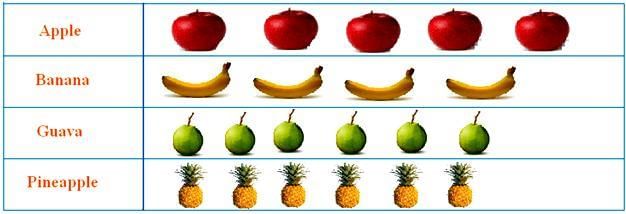
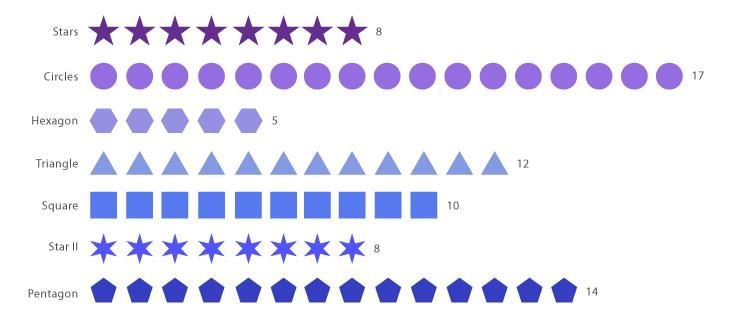
True or False: A pictograph can provide a quick visual representation of data. |
|
Card: 37 / 50 |
How many students participated in the activity of dancing if it is represented by 5 pictures in a pictograph? |
|
Card: 41 / 50 |
Which snack had the highest representation in a pictograph if cookies are represented by 7 pictures? |
|
Card: 43 / 50 |
Riddle: I represent data without numbers, and I can show you how many students like different snacks with pictures. What am I? |
|
Card: 45 / 50 |
What advantage does a pictograph offer over traditional numerical data representation? |
|
Card: 46 / 50 |
A pictograph allows for quick understanding and comparison of data at a glance through visual elements. 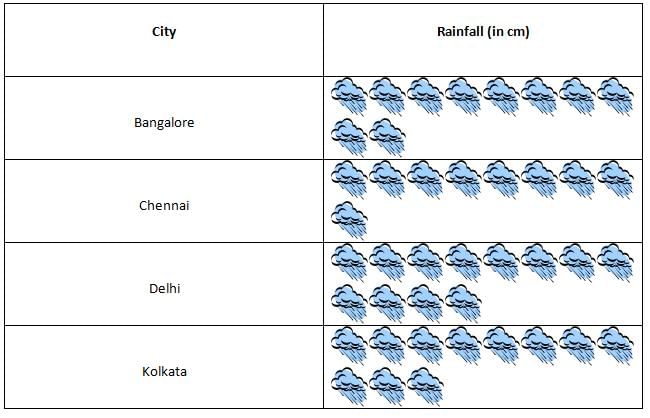 |
|
Card: 48 / 50 |
1. Collect data on favorite snacks, 2. Decide the scale for the pictograph (e.g., one picture represents one student), 3. Draw pictures representing the number of students who selected each snack, 4. Label the pictograph clearly. |


