|
Card: 2 / 42 |
The primary purpose is to aid in comparison and analysis, making the data easier to comprehend. |
|
Card: 3 / 42 |
Fill in the blank: The key objectives of data classification include simplification, utility, and ___. |
|
Card: 9 / 42 |
Riddle: I am the first step in making data understandable, without me, analysis is tough. What am I? |
|
Card: 11 / 42 |
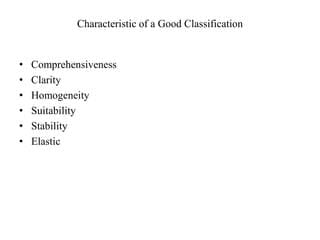
Fill in the blank: Characteristics of a good classification include homogeneity, stability, and ___. |
|
Card: 14 / 42 |
Chronological classification refers to organizing data based on time sequences. |
|
Card: 16 / 42 |
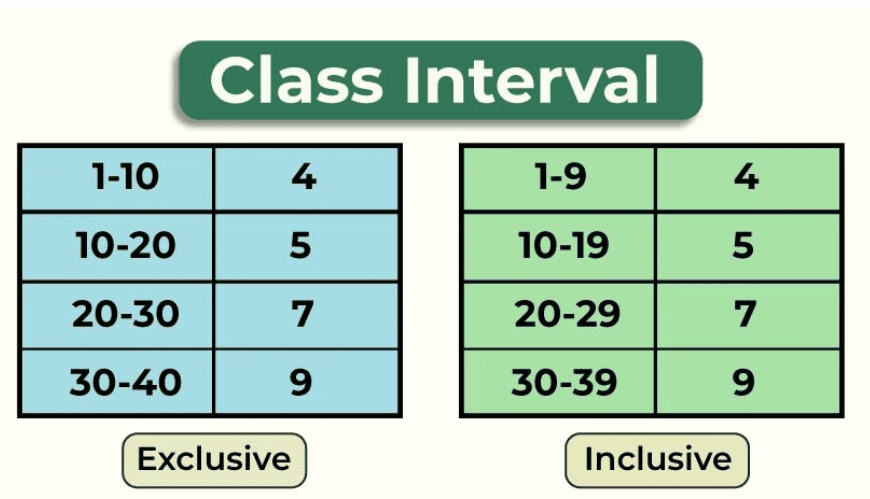
Class limits are the numerical figures that specify the lower and upper limits of a class interval. 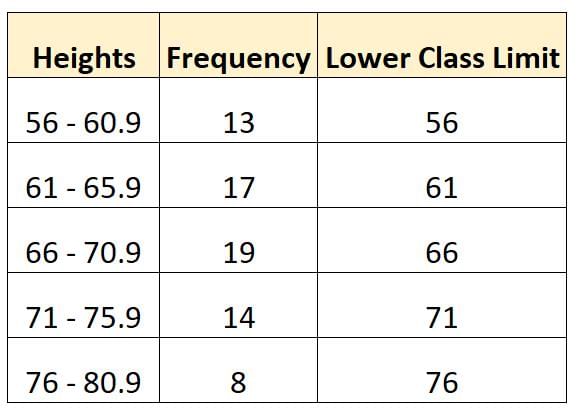 |
|
Card: 17 / 42 |
Fill in the blank: A class interval is used to group variable values such as age groups, for example, 15-19 years, 20-24 years, and ___ years. |
|
Card: 22 / 42 |
Class midpoints or class marks represent the central value of each class interval, facilitating data analysis and representation. 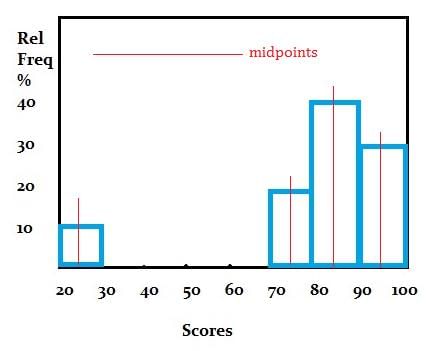 |
|
Card: 23 / 42 |
Riddle: I represent the width of a group of values, crucial in data classification, and help in organizing information. What am I? |
|
Card: 26 / 42 |
A frequency curve is a graphical representation that shows the distribution of data points in a dataset, illustrating how often each value or range of values occurs. 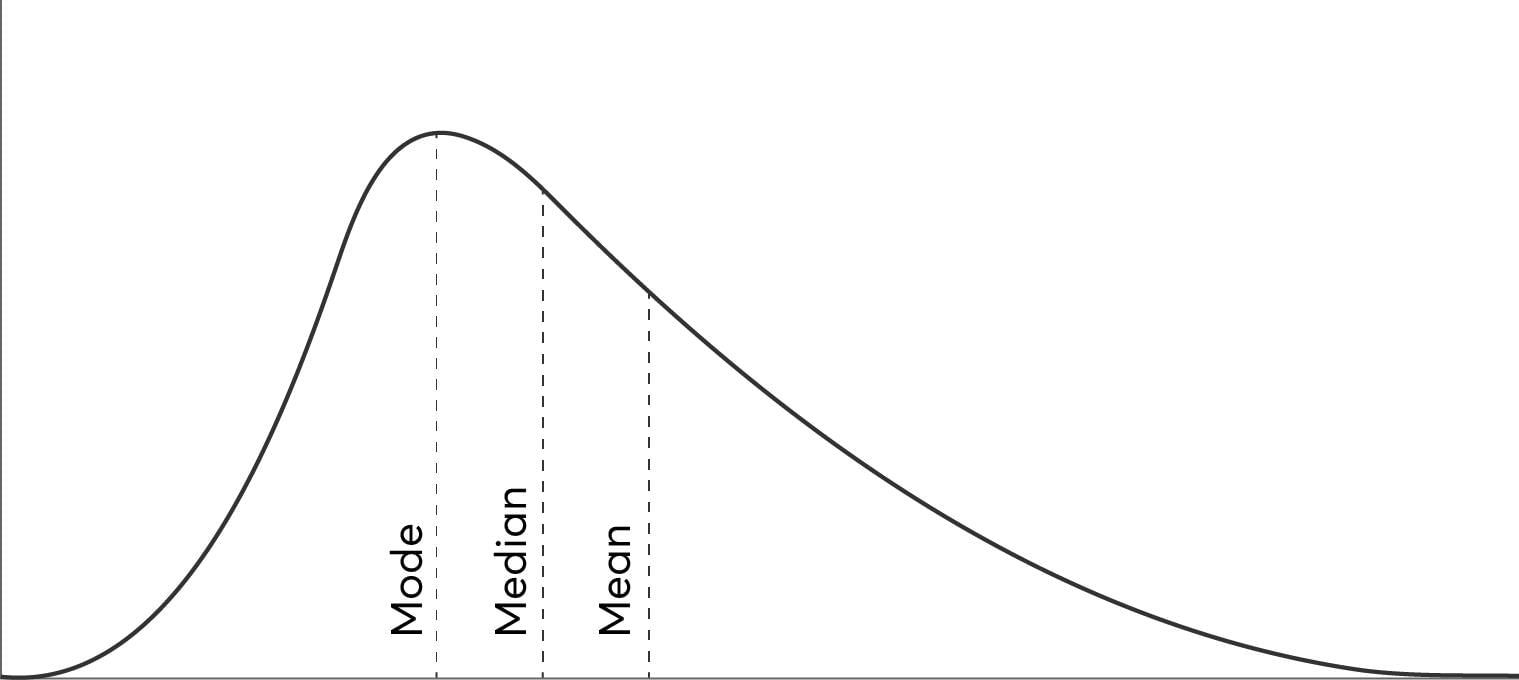 |
|
Card: 27 / 42 |
Fill in the blank: A bivariate frequency distribution involves two variables and is used to study the relationship between them, while a univariate frequency distribution involves ___ variable. |
|
Card: 30 / 42 |
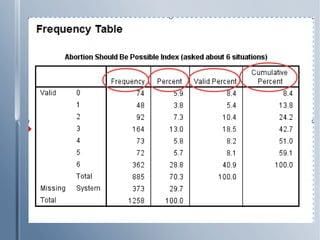
Tally marking provides a quick and efficient way to count and record frequencies of occurrences within a dataset. 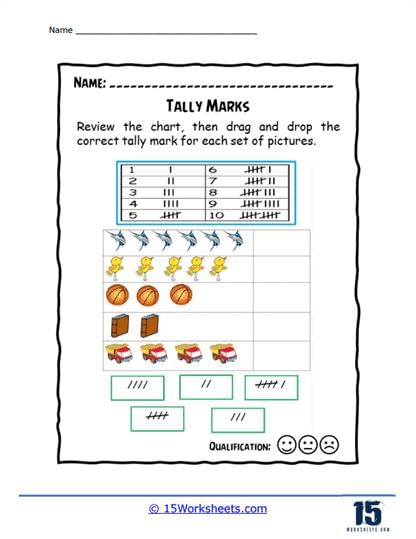 |
|
Card: 32 / 42 |
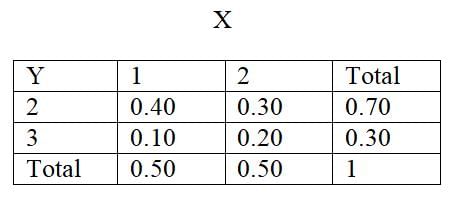
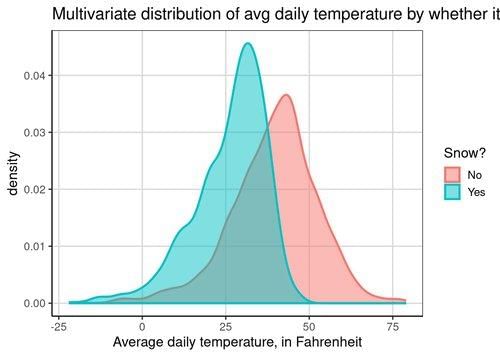
A multivariate distribution describes the probability distribution of two or more random variables, capturing the relationships and joint behavior among them. |
|
Card: 33 / 42 |
Fill in the blank: The joint probability distribution of random variables X and Y is often denoted as ___(X, Y). |
|
Card: 35 / 42 |
True or False: A multivariate normal distribution can only be defined for continuous random variables. |
|
Card: 38 / 42 |
Covariance measures the degree to which two random variables change together, providing insight into their relationship and dependence. 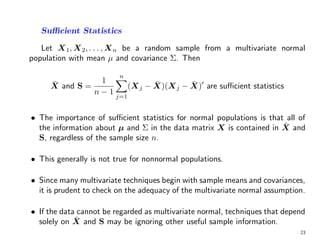 |
|
Card: 39 / 42 |
Riddle: I have many variables that can change, but my outcome is a single distribution. What am I? |
|
Card: 41 / 42 |
Fill in the blank: In a multivariate distribution, the ___ matrix contains the variances and covariances of the random variables. |


