|
Fill in the blank: The collection of information in the form of numerical figures is called ___. |
Card: 7 / 26 |
|
If 5 students like basketball, 6 like soccer, and 4 like tennis, how many students like sports in total? |
Card: 9 / 26 |
|
Rohit surveyed 26 students. If 10 liked cricket, how many did not prefer cricket? |
Card: 11 / 26 |
|
If a bar graph shows 8 students for football and 4 for baseball, what is the ratio of football to baseball preferences? |
Card: 13 / 26 |
 Unlock all Flashcards with EduRev Infinity Plan Starting from @ ₹99 only
|
|
What is the appropriate scale to use if 1 cm represents 2 students on a double bar graph? |
Card: 15 / 26 |
|
The scale indicates that for every 1 cm height on the graph, it corresponds to 2 students. |
Card: 16 / 26 |
|
In a double bar graph, if one bar represents 10 boys and another represents 8 girls, what is the total number of students represented? |
Card: 17 / 26 |
|
True or False: A double bar graph can be used to compare data from two different categories. |
Card: 19 / 26 |
|
If the vertical axis represents the number of students and shows a height of 6 cm, how many students does this represent using the scale of 1 cm = 2 students? |
Card: 21 / 26 |
|
Fill in the blank: A double bar graph typically consists of two bars for each category, representing different ___ or groups. |
Card: 23 / 26 |
|
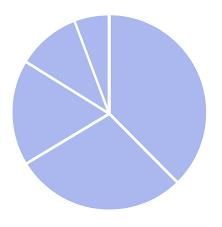
A pie chart is divided into sectors that represent a part or a ___ of the whole. |
Card: 25 / 26 |


