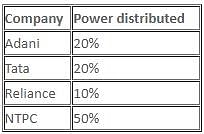
Directions: The following pie chart depicts the percentage breakup of power distribution to four states by various electric power companies of India in the year 2017.

The second layer of the pie chart depicts the megawatt distribution (in thousands) by the given four power companies. It is also known that these companies distribute power only to the state mentioned and the power distributed to any state by a company is an integral multiple of 1000. These 4 states are mentioned in the outermost layer of the pie chart and get power from those 4 companies only.
Question for 12 Minute Test: Pie Charts
Try yourself:What is the least megawatt that could be distributed by NTPC to Kerala?
Explanation
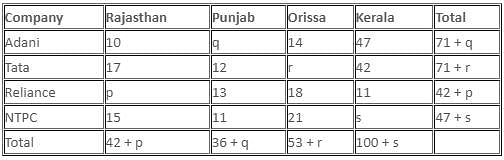
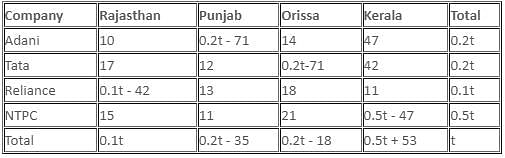
From the given pie chart, we can depict the following information.
Let the power distributed by Reliance to Rajasthan be p, Adani to Punjab be q, Tata to Orissa be r and NTPC to Kerala be s.
Total power distributed = t
From pie chart, total power distributed by NTPC = 50% of t
47 + s = 0.5t
s = 0.5t - 47
Also, r = 0.2t - 71, q = 0.2t - 71 and p = 0.1t - 42
The power generated cannot be negative, thus limiting conditions by equating to 0.
Therefore,
0.1t = 42
t = 420 (minimum value for which p will be positive)
0.2t = 71
t = 355 (minimum value for which q and r will be positive)
0.5t = 47
t = 94 (minimum value for which s will be positive)
Therefore, the least value of t will be 420.
Thus, the least megawatt that NTPC could have distributed to Kerala = 0.5t - 47 = 0.5 × 420 - 47 = 210 - 47 = 163
Therefore, the least megawatt that NTPC could have distributed to Kerala is 163 thousand, i.e. 1,63,000 MW.
Report a problem
Question for 12 Minute Test: Pie Charts
Try yourself:The state(s) to which maximum megawatts of power is distributed, if the total power distributed by all companies is 500 megawatt (in thousands), is/are
Explanation
Report a problem
Question for 12 Minute Test: Pie Charts
Try yourself:What percentage of total power distributed by Tata to Rajasthan is the total power distributed by Reliance to Punjab?
Explanation
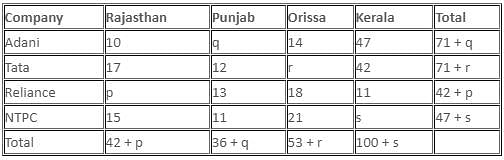
From the given pie chart, we can depict the following information.
Let the power distributed by Reliance to Rajasthan be p, Adani to Punjab be q, Tata to Orissa be r and NTPC to Kerala be s.
Total power distributed = t
From pie chart, total power distributed by NTPC = 50% of t
47 + s = 0.5t
s = 0.5t - 47
Also, r = 0.2t - 71, q = 0.2t - 71 and p = 0.1t - 42
Total power distributed by Tata to Rajasthan = 17,000 MW
Total power distributed by Reliance to Punjab = 13,000 MW
x% of 17,000 = 13,000
x%
Therefore, x = 76.5%
Report a problem
Question for 12 Minute Test: Pie Charts
Try yourself:If the power distributed to Kerala is six times the power distributed to Rajasthan, then the power distributed to Orissa will be
Explanation
From the given pie chart, we can depict the following information.
Let the power distributed by Reliance to Rajasthan be p, Adani to Punjab be q, Tata to Orissa be r and NTPC to Kerala be s.
Total power distributed = t
From pie chart, total power distributed by NTPC = 50% of t
47 + s = 0.5t
s = 0.5t - 47
Also, r = 0.2t - 71, q = 0.2t - 71 and p = 0.1t - 42
Total power distributed to Kerala = 0.5t + 53
Total power distributed to Rajasthan = 0.1t
Given, the power distributed to Kerala is six times the power distributed to Rajasthan.
Then, power distributed to Orissa
Thus, power distributed to Orissa = 88,000 MW
Report a problem


 MW (in thousands)
 MW (in thousands)
 MW (in thousands)
 MW (in thousands)