Bar Charts | Know Your Aptitude Class 6 To 8 - Class 8 PDF Download
Bar Graph
A bar graph is nothing but a pictorial representation of data wherein every independent variable attains only discrete value. They are used for representing various types of data.
The bar graph is one of the frequent methods used to present various types of data. It is usually asked in the data interpretation section of the competitive exams. In data interpretation, it is the representation of data where the vertical bars are placed at equal distance from each other. The value of the data represented is given by the height and length of the bars. The width here is not important it is only used so that the presentation is clear.
They are plotted against the horizontal axis known as the x-axis. The value can be shown by coloured or shaded vertical bars of equal width. In a horizontal bar graph, the values are plotted against the vertical axis called the y-axis. They are commonly used as the data can be easily analyzed.
Types of Bar Graph
There are types of bar graphs used to represent the data. They are as follows:
1. Simple Bar Chart
As the name suggests simple bar chart is the simplest bar graph of all. It is used to describe one continuous variable along with the one discrete value. The figure below shows the proper representation of a simple bar chart.
2. Composite Bar Chart
To solve the limitation of simple bar chart composite bar chart is used. We use a composite bar chart to show two or more than two continuous variables on the same graph. This is the figure below that describes how a composite bar-chart looks like.

3. Stacked Bar Chart
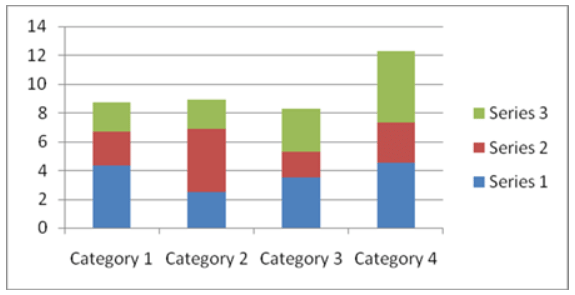
Stacked bar charts are used to represent the break-up of the content for continuous variables. It is very convenient to use it for comparing different sets of data. It can be used to represent factors such as revenues, profits, losses over a period of couple years. The figure below describes the same.
4. Bar Charts to Show Deviation
Mostly bar charts are used to show the deviation. And that is why the bar charts that are used to show the deviation are very common. Deviation charts can show the deficit as well as the surplus, imports, and exports, etc. It is usually required to represent the positive as well as negative values of the continuous variables.
|
5 videos|60 docs|13 tests
|

|
Explore Courses for Class 8 exam
|

|


