Bar Graphs CAT Previous Year Questions with Answer PDF
Passage - 1
 The horizontal bars in the above diagram represent 2020 aggregate sales (in ₹ million) of a company for the different subcategories of its products. The top four product subcategories (Bookcases, Chairs, Furnishings, Tables) belong to furniture product category; the bottom four product subcategories (Accessories, Copiers, Machines, Phones) belong to the technology product category while all other product subcategories belong to the office supply product category. For each of the product subcategories, there is a vertical line indicating the sales of the corresponding subcategory in 2019.
Passage - 2

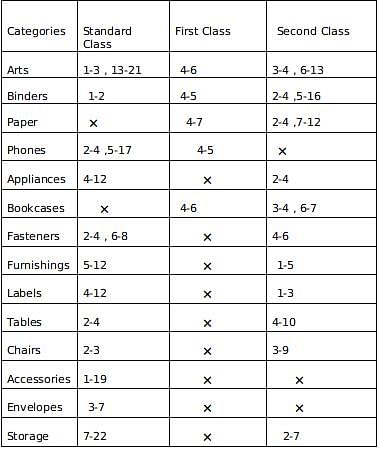
The different bars in the diagram above provide information about different orders in various categories (Art, Binders, ….) that were booked in the first two weeks of September of a store for one client. The colour and pattern of a bar denotes the ship mode (First Class / Second Class / Standard Class). The left end point of a bar indicates the booking day of the order, while the right end point indicates the dispatch day of the order. The difference between the dispatch day and the booking day (measured in terms of the number of days) is called the processing time of the order. For the same category, an order is considered for booking only after the previous order of the same category is dispatched. No two consecutive orders of the same category had identical ship mode during this period.
For example, there were only two orders in the furnishing category during this period. The first one was shipped in the Second Class. It was booked on Sep 1 and dispatched on Sep 5. The second order was shipped in the Standard class. It was booked on Sep 5 (although the order might have been placed before that) and dispatched on Sep 12. So the processing times were 4 and 7 days respectively for these orders.


Passage - 3
 The figure above shows the schedule of four employees - Abani, Bahni, Danni, and Tinni - whom Dhoni supervised in 2020. Altogether there were five projects which started and concluded in 2020 in which they were involved. For each of these projects and for each employee, the starting day was at the beginning of a month and the concluding day was the end of a month, and these are indicated by the left and right end points of the corresponding horizontal bars. The number within each bar indicates the percentage of assigned work completed by the employee for that project, as assessed by Dhoni.
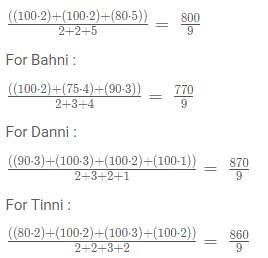
For each employee, his/her total project-month (in 2020) is the sum of the number of months (s)he worked across the five projects, while his/her annual completion index is the weightage average of the completion percentage assigned from the different projects, with the weights being the corresponding number of months (s)he worked in these projects. For each project, the total employee-month is the sum of the number of months four employees worked in this project, while its completion index is the weightage average of the completion percentage assigned for the employees who worked in this project, with the weights being the corresponding number of months they worked in this project.
I: The total project-month was the same for the four employees.
II: The total employee-month was the same for the five projects.
|
88 videos|119 docs|91 tests
|
FAQs on Bar Graphs CAT Previous Year Questions with Answer PDF
| 1. How to interpret a bar graph? |  |
| 2. What is the purpose of using a bar graph? | |
| 3. How to create a bar graph from given data? | |
| 4. What are the different types of bar graphs? | |
| 5. How can a bar graph help in making data-driven decisions? | |

|
2.4K Views |

|
4.66/5 Rating |

|
Dec 22, 2024 Last updated |
|
88 videos|119 docs|91 tests
|

|
Explore Courses for CAT exam
|
|
study material
,Important questions
,Exam
,MCQs
,Summary
,Objective type Questions
,ppt
,Bar Graphs CAT Previous Year Questions with Answer PDF
,Semester Notes
,Free
,practice quizzes
,past year papers
,shortcuts and tricks
,video lectures
,Viva Questions
,Extra Questions
,Previous Year Questions with Solutions
,Bar Graphs CAT Previous Year Questions with Answer PDF
,Bar Graphs CAT Previous Year Questions with Answer PDF
,Sample Paper
,mock tests for examination
;


CAT Previous Year Questions: Bar Graphs Free PDF Download
Importance of CAT Previous Year Questions: Bar Graphs
CAT Previous Year Questions: Bar Graphs Notes
CAT Previous Year Questions: Bar Graphs CAT
Study CAT Previous Year Questions: Bar Graphs on the App
|
© EduRev
|
Education Revolution
|


|


