CBSE Class 11 Economics Sample Paper - 1 | Economics Class 11 - Commerce PDF Download
Time : 3 Hours
Maximum Marks : 80
General Instructions:
- This question paper contains two sections:
Section A – Statistics for Economics Section B – Introductory Micro Economics - This paper contains 20 Multiple Choice Questions type questions of 1 mark each.
- This paper contains 4 Short Answer Questions type questions of 3 marks each to he answered in 60 to 80 words.
- This paper contains 6 Short Answer Questions type questions of 4 marks each to he answered in 80 to 100 words.
- This paper contains 4 Long Answer Questions type questions of 6 marks each to he answered in 100 to 150 words
"Section - A"
Q1: Read the following Assertion (A) and Reason (R) and choose the correct alternative: [1 Mark]
Assertion (A): The Class Interval needs to be continuous while drawing a Histogram.
Reason (R): Histogram is a rectangular diagram using frequency distributions which are joined to one another.
(a) Both Assertion (A) and Reason (R) are true, and Reason (R) is the correct explanation of Assertion (A)
(b) Both Assertion (a) and Reason (R) are true, but Reason (R) is not the correct explanation of Assertion (A).
(c) Assertion (A) is true, but Reason (R) is false.
(d) Assertion (A) is false, but Reason (R) is true.
Ans: (b)
It is necessary to prepare a histogram; the series of data should be in continuous series. It is a graphical presentation of a frequency distribution of a continuous series.
Q2: The investigator appoints local persons or correspondents at different places. They collect information in their
own way and furnish the same to the investigator. [1 Mark]
Identify the above source of data.
(a)Primary Data Source
(b)Secondary Data Source
(c) Both (a) & (b)
(d) Neither (a) Nor b)
Ans: (a)
Primary data is one which an investigator collects for the first time for a particular purpose. Information from local source or correspondents are primary data sources under which the investigator appoints local persons or correspondents at different places
Q3: An index number which accounts for the relative importance of the item is known as________ . [1 Mark]
(a)Simple Index Number
(b)Weighted Index Number
(c)Aggregate Index Number
(d)Average Index Number
Ans: (b)
A weighted index is a stock index in which each company included in the index makes up a fraction of the total index proportionate to that company’s share stock price per share. It is the weighted average of the prices of different goods.
Q4: There are two statements given below, marked as Statement (I) and Statement (II). Read the statements and
choose the correct option: [1 Mark]
Statement – I The Arithmetic Mean is the amount secured by dividing the sum of value of the items in a series by their numbers.
Statement – II An Average is a figure that represents the whole group.
(a) Only I is true
(b) Only II is true
(c) Both I & II are true
(d) Both I & II are false.
Ans: (c)
Mean is the number which is obtained by adding the value of all the items of a series and dividing the total by the number of items and it is a single figure that represent the whole series.
Q5: Which of the following facts is statistics: [1 Mark]
(a)Ram secured 66% marks in English.
(b)Ram secured 80% marks in Mathematics.
(c)Ram secured 90% marks in Economics.
(d)Ram secured 90% marks in Economics, this year, whereas he secured 80% marks in Economics previous year.
Ans:(d)
Ram secured 90% marks in Economics but he gets 80 % in previous year. This would mean making a comparison over different years marks of economics. This is facts concept in statistics.
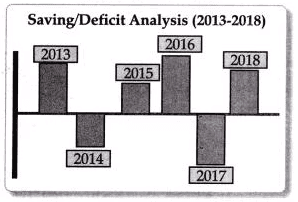
Q6: Identify the following diagram: [1 Mark]
 (a)Pie Diagrams
(b) Deviation Bar Diagram
(c) Percentage Bar Diagram
(d) Subdivide Bar Diagram
Ans: (b)
Deviation bar graphs are simply two bar charts aligned, where one of the charts runs right to left rather than left to right. The two charts report on the same categories but differ in terms of the respondent group or some other variable. Deviation bar diagrams representing positive and negative deviations. In given picture, the deviations are drawn above and below the base line.
Q7: Which of the following is not a method to measure correlation: [1 Mark]
(a)Karl Pearson’s Coefficient of correlation.
(b) Spearman’s rank difference method.
(c)Scatter diagram method.
(d) Step Deviation Method
Ans:d)
There are three methods to measure correlation – Karl Pearson’s Coefficient of Correlation, Spearman’s Rank Difference Method and Scatter Diagram Method.
Q8: Find out the mode value from the following data: [1 Mark]
8,5,10,8,5,11,9,6,5,8,5,3,5,3,8,5,8,9,5,8
(a) 8
(b) 6
(c) 5
(d)11
Ans: (c)
On inspection of the given series, the value of 5 occurs most frequently in the series. Thus, the mode value is 5.
Q9: There are two statements given below, marked as Statement (I) and Statement (II). Read the statements and choose the correct option: [1 Mark]
Statement (I) – If we measure the weight of students of class 10th, then the weight of the student will be called variable.
Statement (II) – A variable may also be called a data item.
(a) Statement I is true and statement II is false
(b) Statement I is false and statement II is true
(c) Both statements I and II are true
(d)Both statements I and II are false
Ans:(c)
A characteristic, number, or quantity which is capable of being measured and changes its value overtime is called a variable and it is also known as a data item.
Q10: What type of correlation is present between happiness and death anxiety? [1 Mark]
(a) Positive
(b) Negative
(c) Neutral
(d)Cannot be determined
Ans:(b)
A person cannot be happy during death anxiety.
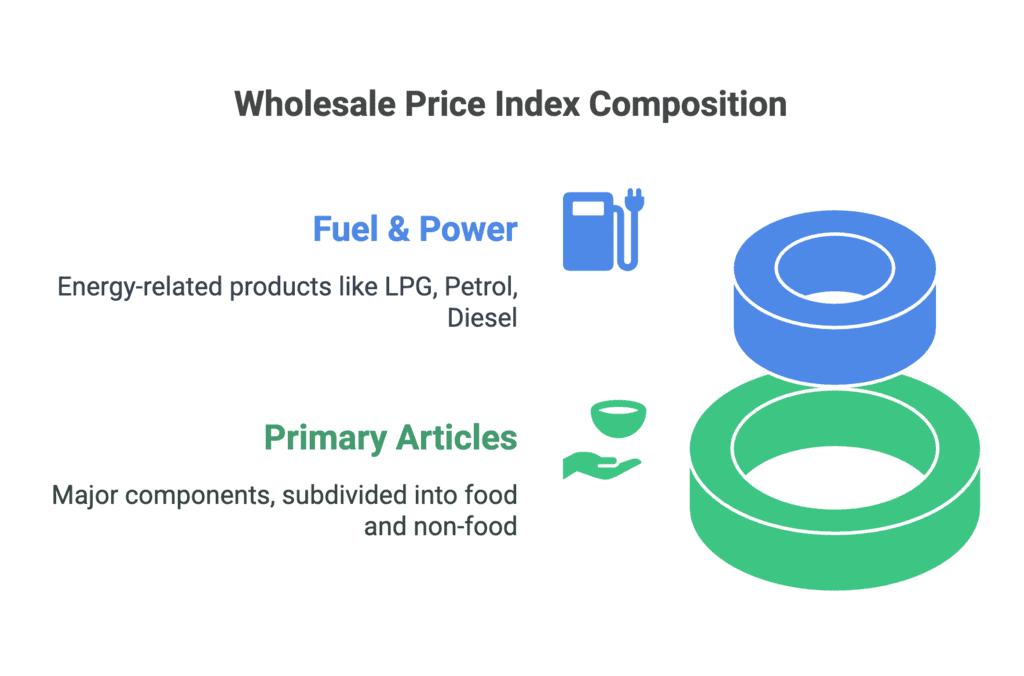
Q11: In how many groups, different commodities have been divided while constructing Wholesale Price Index in
India? [3 Marks]
Ans: In India for the construction of Wholesale Price Index, goods are mainly classified into the following three groups:
(i) Primary Articles: Primary articles are major components of WPI, further subdivided into Food Articles and Non-food Articles.
(a) Food Articles include items such as Cereals, Paddy, Wheat, Pulses, Vegetables, Fruits, Milk, Eggs, Meat and Fish, etc.
(b)Non-food Articles include Oil Seeds, Minerals and Crude Petroleum
(ii) Fuel and power:The fuel and power include energy-related products like LPG, Petrol, Diesel, CNG, etc.
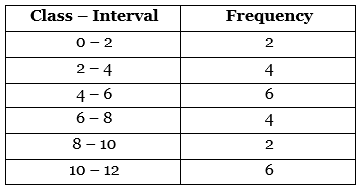
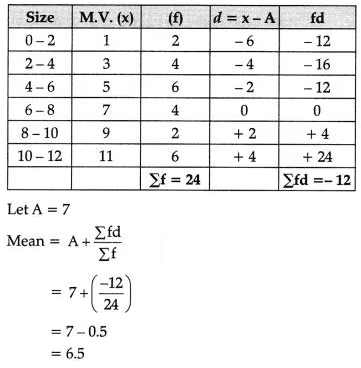
Q12: Calculate mean from the following series: [3 Marks]
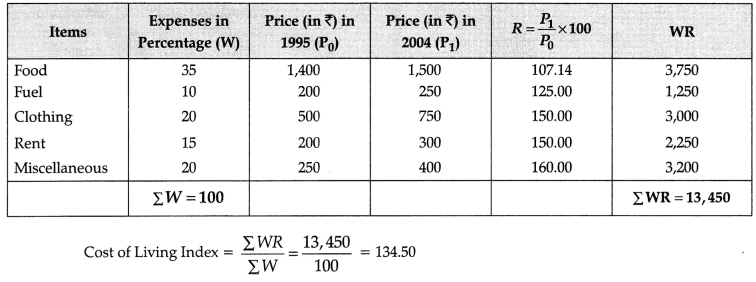
An inquiry into the budget of the middle class families in a certain city gave the following information:
 What is the cost of living index of 2004 as compared with 1995? [3 Marks]
Ans:
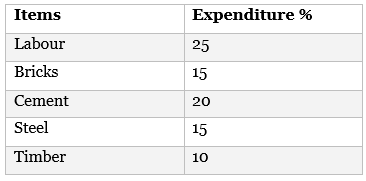
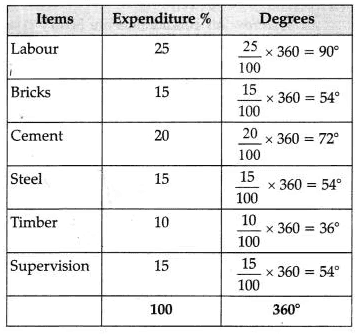
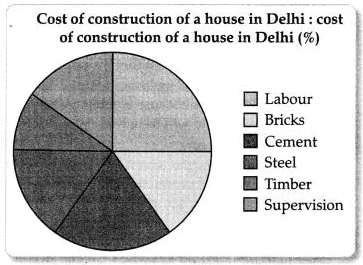
Q13: Construct a pie-diagram to represent the cost of construction of a house in Delhi: [4 Marks]
Ans:
Q14: Find out Median value of the following distribution: [4 Marks]
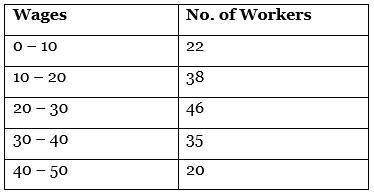
Ans:
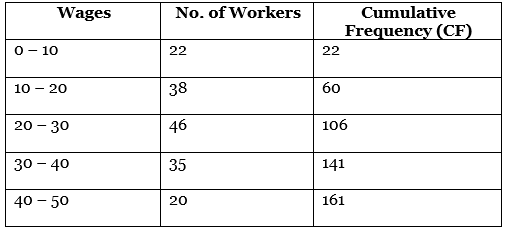
Median value = Size of (N/2)th Items
= Size of (161/2)th Items
Size of 80.5th item (which lies in 20 – 30 wage group)
By Interpolation:
Median = 
WhereL1 = 20, C.F = 60 f = 46 i = 10
Thus, put the above value in formula
Median = 20 + 80.5−60 / 46 × 10
= 20 + 4.45
= 24.45
Q15: “An index number is a statistical device for measuring changes in the magnitude of a group of related variables. It represents the general trend of diverging ratios, from which it is calculated.”
Elaborate how index number measures the changes in the magnitude of variables. [4 Marks]
What is the importance of Statistics in economic planning?
Ans: Index number is a measure of the average change in a group of related variables over two different situations. It helps us to find out percentage change in the values of different variables over time with references to some base year which happens to be the year of comparison. The comparison may be between like categories such as persons, schools, hospitals etc. The method of index number measure alters from one variable to another related variable.
These days almost all the countries of the world adopt the method of planning for economic development. Statistics is the most important tool in economic planning. Statistics helps economic planning by collecting data of national resources both human and natural. For drawing a plan of their use, we need the help of Statistics.
Q16: (a) Draw a frequency polygon of the following distribution of the students obtaining marks in Economics: [3 Marks]
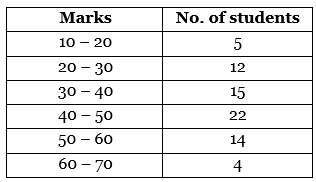
(b) Economics is a science. Give reasons. [3 Marks]
(a) Explain the relationship between statistics and economics. [3 Marks]
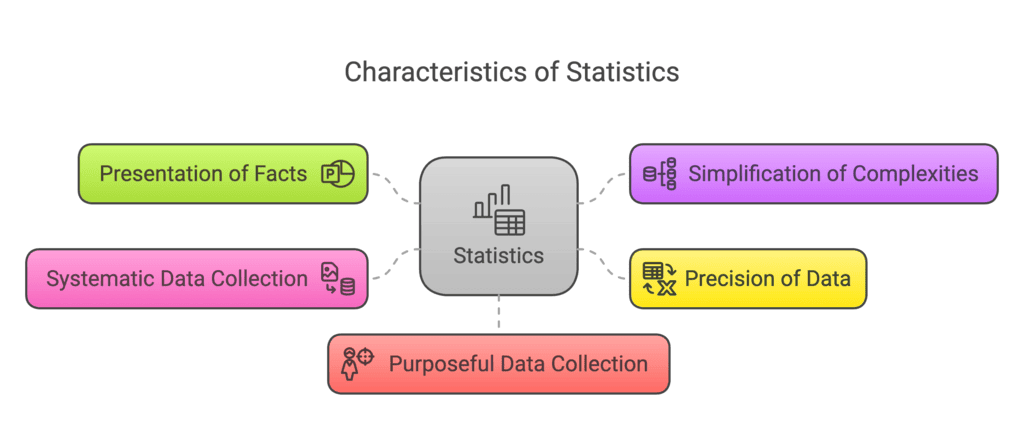
(b) Describe in brief three main characteristics of statistics. [3Marks]
Ans:(a)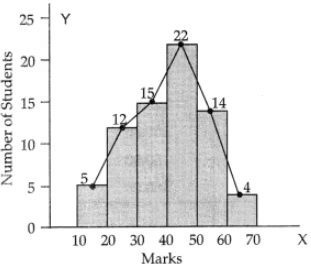 (b)Science is the systematised body of knowledge which creates relationship between causes and their effects. In other words, every discipline which has got certain theories, concepts and laws showing the relationship between causes and effects is science. Economics has got its own theories, concepts, and laws, so it is definitely a science though not an exact science, like physics and chemistry.
(a)Statistics plays an important role in the field of economics. It is an important tool which helps in solving different economic problems. Statistics help in analysing different economic problems which needs immediate attention.
(b) The characteristics of statistics are:
(i) Statistics always presents facts in numbers.
(ii) Statistics make the complexities simple.
(iii) Statistics shows data in a precise manner.
(iv) Data are collected in a systematic manner.
(v) Data are collected for achieving predetermined purposes.
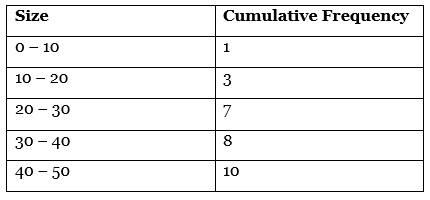
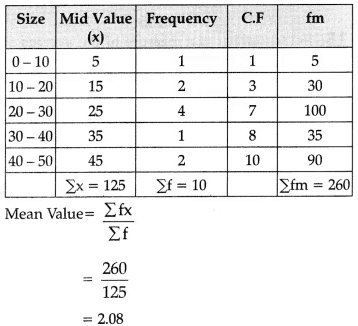
Q17: (a) Calculate mean value from the following data: [3 Marks]
(b) Discuss any three properties of Correlation Coefficient. [3 Marks]
Ans: (a)
 (b) Correlation coefficient is a statistical measure of the strength of a linear relationship between two variables. The properties of Correlation Coefficient are following:
- The value of correlation coefficient lies between minus one and plus one. If the value of correlation lies outside this range, it is indicates error in calculation.
- The correlation coefficient remains constant in the same measurement as the two variables.
- It is a statistical concept used to measure how strong a relationship is between two variables.
"Section – B"
Q18: Identify the correct pair of items from the following Columns I and II: [1 Mark]
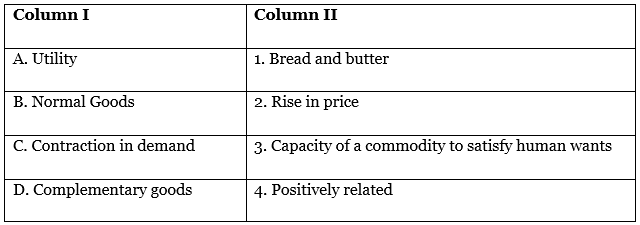
(a) A - 1
(b) B - 2
(c) C - 3
(d) D - 4
Ans:(d)
Complementary goods are positively related with each other. Rise in quantity demanded of one good also brings the increment in quantity demanded of paired goods.
Q19: Which of the following has elastic demand: [1 Mark]
(a)Matchbox
(b)Water
(c) Medicine
(d)Air conditioners
Ans: (d)
Air conditioners are luxury goods, so the demand is elastic.
Q20: A form of market in which “sellers become price taker instead of price maker” firm. Identify the above form of market: [1 Mark]
(a) Perfectly competitive market
(b)Monopoly market
(c)Monopolistic form of market
(d)Oligopoly market
Ans:(a)
Sellers become price taker in perfectiy competitive markets because free play of market forces determines the price of commodity in this form of market.
Q21: Total utility is ______ at the point of satiety. [1 Mark]
(a)Minimum
(b) Maximum
(c) Zero
(d)None of these
Ans: (b)
At the point of satiety, total utility is maximum beyond which it starts decreasing.
Q22: Identify the stage of production from given circumstances according to the law of variable proportion. [1 Mark]
“Average production continues to decrease, total production starts decreasing and marginal product become negative”
(a)First stage
(b)Second stage
(c)Third stage
(d)None of these
Ans:(c)
Given situation refers to the third stage of production under short rim production. According to the law of variable proportion, in the third stage of production, the total product declines and the marginal product becomes negative.
Q23: There are two statements given below, marked as Assertion (A) and Reason (R). Read the statements and choose
the correct option: [1 Mark]
Assertion (A): Demand for salt is inelastic.
Reason (R): In case of elastic demand, percentage change in price of a commodity causes relatively less than percentage change in quantity demanded.
(a) Both Assertion (A) and Reason (R) are true, and Reason (R) is the correct explanation of Assertion (A)
(b) Both Assertion (A) and Reason (R) are true, but Reason (R) is not the correct explanation of Assertion (A)
(c) Assertion (A) is true, but Reason (R) is false.
(d)Assertion (A) is false, but Reason (R) is true.
Ans:(a)
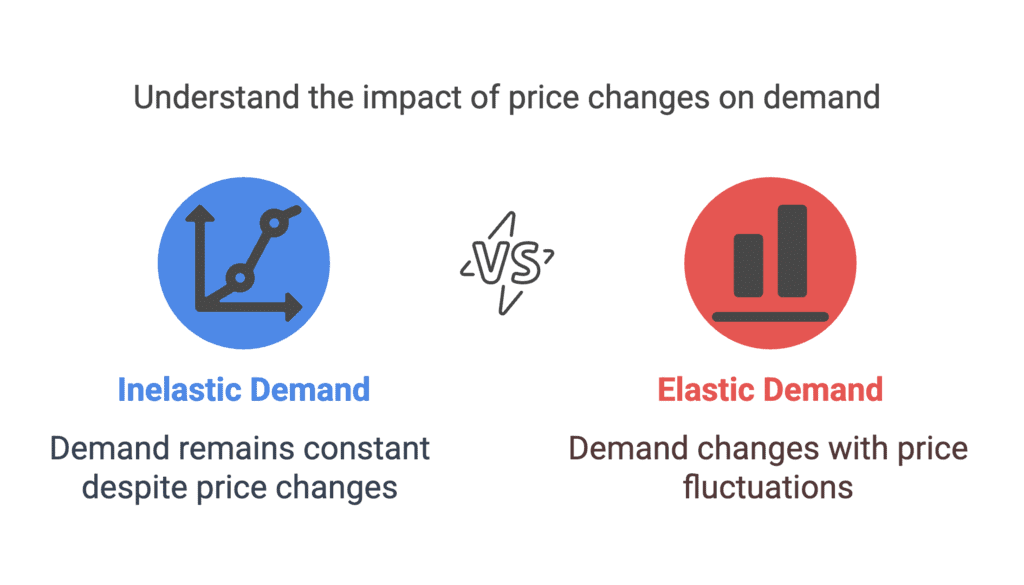
- Necessary goods have inelastic demand.
- Price inelastic demand means there is no change in demand even when there is price change.
- Salt has an price inelastic demand as salt is a necessary good because we need salt everyday. Without it food will taste bad.
Q24: There are two statements given below, marked as Statement (I) and Statement (II). Read the statements and
choose the correct option: [1 Mark]
Statement – I: The society faces a number of difficulties in the production of commodities.
Statement – II: The whole society sacrifices for the production process.
(a) Statement I is true and Statement II is false
(b) Statement I is false and Statement II is true
(c) Both statements I and II are true
(d)Both statements I and II are false
Ans:(c)
Both the given statements are true regarding short run production. Efforts and sacrifices made in the production process are known as real cost or social cost.
Q25: Law of demand states the _______ relationship between price and quantity demanded. [1 Mark]
(a)Direct
(b)Inverse
(c)Proportional
(d)None of the above
Ans:(b)
Law of demand states that when the price of a commodity increases the quantity demanded decreases and vice versa. Thus, it shows the inverse relationship between price and quantity demanded.
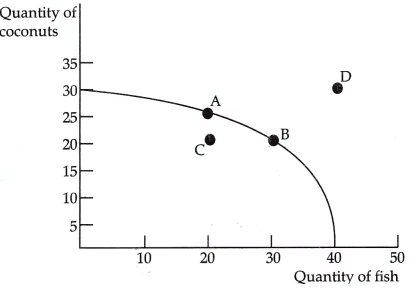
Q26: Given the PPF illustrated, what is the opportunity cost of moving from B to A? [1 Mark]
 (a)5 coconuts
(b)10 fishes
(c)5/10 fish
(d)10/5 coconuts
Ans: (b)
To find the opportunity cost of moving from point B to point A on the Production Possibility Frontier (PPF), let's analyze the quantities given in the graph.
- At point B: The quantity of fish is approximately 30, and the quantity of coconuts is approximately 20.
- At point A: The quantity of fish is approximately 20, and the quantity of coconuts is approximately 25.
When moving from B to A:
- The quantity of fish decreases from 30 to 20, a reduction of 10 fish.
- The quantity of coconuts increases from 20 to 25, an increase of 5 coconuts.
The opportunity cost is the amount of fish given up to gain additional coconuts. In this case, moving from B to A, you give up 10 fish to gain 5 coconuts.
Thus, the opportunity cost of moving from B to A is: 10 fishes.
So, the correct answer is: (b) 10 fishes.
Q27: There are two statements given below, marked as Statement (I) and Statement (II). Read the statements and choose the correct option: [1 Mark]
Statement – I : Supply function refers to the functional relationship between supply of a commodity and its determining factors.
Statement – II: The supply function is used to measure price elasticity demand for goods and services.
(a)Statement I is true and Statement II is false
(b) Statement I is false and Statement II is true
(c) Both statements I and II are true
(d) Both statements I and II are false
Ans:(c)
The functional relationship between supply of the commodity and its determining factors is called supply function and it is used to measure price elasticity demand for goods and services.
Q28: (a) Average product increases only when marginal product increases. [3 Marks]
(b) Total cost can never be constant.
Do you agree with the above statements? Justify your answer with valid argument.
Ans: (a) False, because AP increases so long as MP is greater than AP, whether MP is rising or falling.
(b) True, because TC can be constant only when MC is zero, which is not possible.
Q29: What are the characteristics of a perfectly competitive market? [3 Marks]
Explain the implications of the feature “homogeneous product” in a perfectly competitive market.
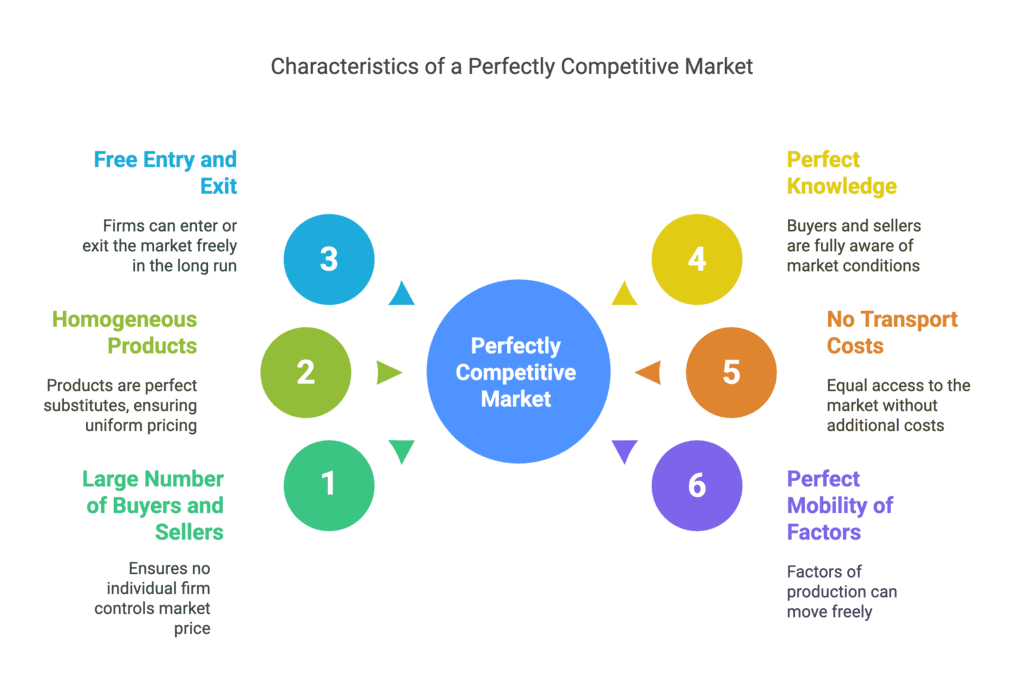
Ans: Perfect Competition: This type of market structure refers to the market that consists of a large number of buyers and also a large number of sellers. No individual seller is able to influence the price of an existing product in the market. All sellers in a perfect competition produce homogenous outputs, i.e., the outputs of all the sellers are similar to each other and the products are uniformly priced.
Characteristics of a Perfectly Competitive Market:
- Large number of buyers and sellers:There exist a large number of buyers and sellers in a perfectly competitive market. The number of sellers is so large that no individual firm owns the control over the market price of a commodity. Due to the large number of sellers in the market, there exists a perfect and free competition.
- Homogenous products:All the firms in a perfectly competitive market produce homogeneous products. This implies that the output of each firm is perfect substitute to others’ output in terms of quantity, quality, colour, size, features, etc. This indicates that the buyers are indifferent to the output of different firms. Due to the homogenous nature of products, existence of uniform price is guaranteed.
- Free exit and entry of firms:In the long-run, there is free entry and exit of firms. However, in the short run some fixed factors obstruct the free entry and exit of firms. This ensures that all the firms in the long-run earn normal profit or zero economic profit that measures the opportunity cost of the firms either to continue production or to shut down.
- Perfect knowledge among buyers and sellers: Both buyers and sellers are fully aware of the market conditions; such as price of a product at different places. The sellers are also aware of the prices at which the buyers are willing to buy the product. The implication of this feature is that if any individual firm is charging higher (or lower) price for a homogeneous product, the buyers will shift their purchase to other firms (or shift their purchase from the firm to other firms selling at lower price).
- No transport costs: This feature means that all the firms have equal access to the market. The goods are produced and sold locally. Therefore, there is no cost of transporting the product from one part of the market to other.
- Perfect mobility of factors of production:There exists geographically and occupationally perfect mobility of factors of production. This implies that the factors of production can move from one place to other and can move from one job to another. (Any three)
Homogeneous products imply that the products are identical in quality, shape, size and colour. So, no producer is in a position to charge a different price for the product it produces. A uniform price prevails in the market. In a perfectly competitive market, commodity is homogeneous (identical). Thus, the buyers find no reason to prefer the product of one seller to the product of another. Hence, the firms are price takers. In a perfectly competitive environment, homogeneous product does not allow a firm any control over its price. Accordingly, firm’s demand curve (under perfect competition) becomes a horizontal straight line.
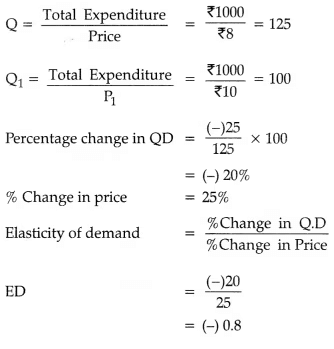
Q30: A consumer spends ₹1,000 on a good priced at ₹8 per unit. When price rises by 25 percent, the consumer continues
to spend ₹1,000 on the good. Calculate price elasticity of demand by percentage method. [4 Marks]
Ans:
Given, P = ₹8, Total expenditure = ₹1,000. If P increases by 25%, i.e., 25% of ₹8 would be ₹2
Thus, New Price P1 = ₹8 + ₹2 = ₹10.
Here again
Total Expenditure = ₹1,000
Total Expenditure = ₹1,000
Q31: Complete the following table: [4 Marks]

Giving reasons, state whether the following statements are true or false: [4 Marks]
(i) Average product will increase only when marginal product increases.
(ii) With increase in level of output, average fixed cost goes on falling till it reaches zero.
(iii) Under diminishing returns to a factor, total product continues to increase till marginal product reaches zero.
(iv) When there are diminishing returns to a factor, total product always increases.
Ans:
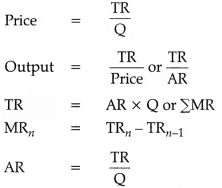
(i) False. Average product will increase only when marginal product is greater than average product whether MP is rising or falling.
(ii) False. AFC = TFC/Output. TFC is constant and positive. So with an increase in output AFC will fall but can never be zero.
(iii) True. Under diminishing returns MP falls. TP increases till MP is positive.
(iv) False. This is because in a situation of diminishing returns to a factor marginal product tends to fall. Falling MP implies that total product should be increasing, though at a diminishing rate. TP will increase till MP remains positive.
Q32: Using a diagram explain what happens to the PPC of Kashmir if the widespread floods have led to the destruction
of human lives? [4 Marks]
Ans:Production possibility curve (or PPC) is drawn on the assumption that the given resources are fully as well as efficiently utilised. If the widespread floods in Kashmir have led to the destruction of human lives, it implies the loss of manpower. This will shift the PPC leftward from ab to ajbj, as shown in Figure.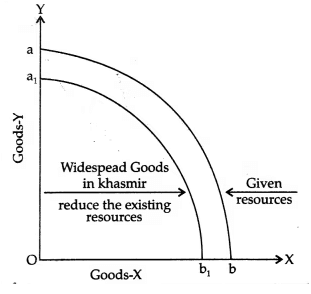
Q33: (a) Central problems arise because resources and scarce and have alternate uses and want are unlimited. Explain. [3 Marks]
(b) Describe the problem of “What to Produce?”.
(a) Explain the meaning and implications of maximum price ceiling and minimum price ceiling.
(b) Define Price Ceiling. What is the common purpose for the price ceiling imposed by the government? Explain any one likely consequence of this nature of intervention by the government in the price determination process. [3 Marks]
Ans:(a) Central problem of all economies is scarcity. Scarcity forces individuals, firms, governments and societies to make choices. By this, three basic questions arise :
(i) What to produce,
(ii)How to produce,
(iii)For whom to produce. 2 + 1 = 3
(b)This problem involves selection of goods and services to be produced and the quantity to be produced of each selected commodity. Every economy has limited resources and thus, cannot produce all the goods. More of one good or service usually means less of others. For example, production of more sugar is possible only by reducing the production of other goods. Production of more war goods is possible only by reducing the production of civil goods. So, on the basis of the importance of various goods, an economy has to decide which goods should be produced and in what quantities. This is a problem of allocation of resources among different goods. The problem of ‘What to produce’ has two aspects :
(i) What possible commodities to produce : An economy has to decide which consumer goods (rice, wheat, clothes, etc.) and which of the capital goods (machinery, equipment, etc.) are to be produced. In the same way, economy has to make a choice between civil goods (bread, butter, etc.) and war goods (guns, tanks, etc.).
(ii) How much to produce : After deciding the goods to be produced, economy has to decide the quantity of each commodity that is selected. It means, it involves a decision regarding the quantity to be produced, of consumer and capital goods, civil and war goods and so on.
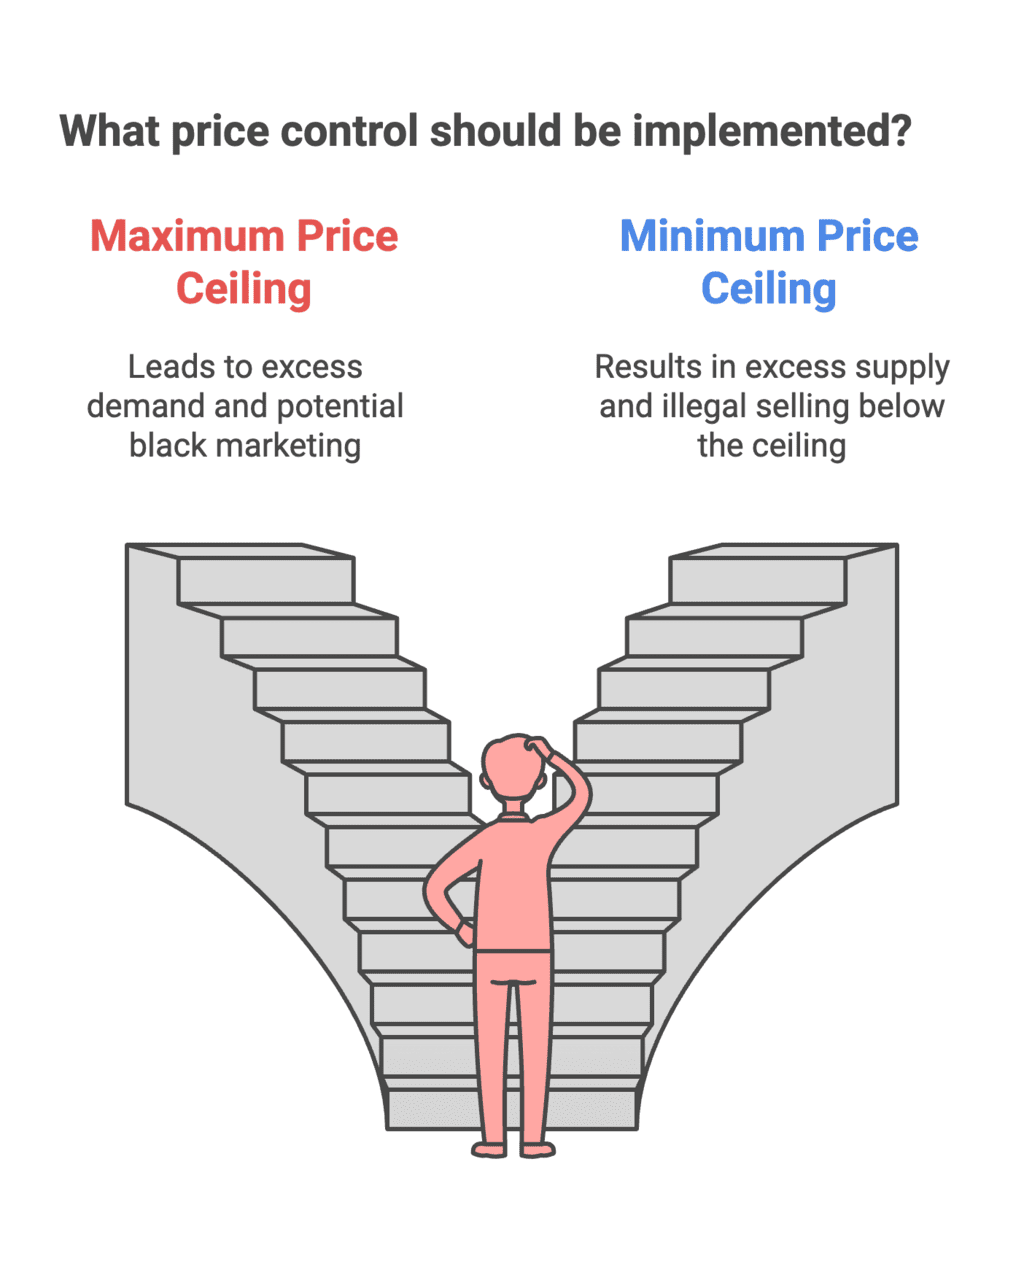
(a)When the government imposes upper limit on the price of a good it is called maximum price ceiling. It is fixed below the equilibrium price.
- Implication (maximum price ceiling) : It will lead to excess demand. This in turn may lead to black marketing of goods.
When the government imposes lower limit on the price of a good, it is called minimum price ceiling - Implication (minimum price ceiling) :It leads to excess supply. This in turn may lead to illegal selling below the ceiling price as the producers are not able to sell what they desire to sell.
(b) Price Ceiling: Price ceiling means the maximum limit that the government imposes on the price of a commodity. Price ceiling are used by the government to prevent prices from being too high.
The main reason for imposing price ceilings is to protect the interests of the consumers in situations in which they are not able to afford needed commodities. For example – During the recent rise in the prices of pulses.
Consequence: Shortages of the commodity and rationing : In case of price ceiling the quantity actually supplied in the market will shrink; as a result, a large chunk of consumer’s demand will go unsatisfied. To deal with such a situation the government may resort to rationing of the commodity.
Q34: Read the passage given below and answer the questions that are followed:
Production, exchange and consumption of goods and services are among the basic economic activities of life. In the course of these basic economic activities, every society has to face scarcity of resources and it is the scarcity of resources that gives rise to the problem of choice. The scarce resources of an economy have competing usages. In other words, every society has to decide on how to use its scarce resources. Every society must decide on how mu(h of each of the many possible goods and services it will produce. Whether to produce more of food, clothing, housing or to have more of luxury goods.
(a) Why does the problem of ‘what to produce’ arise? Explain. [2 Marks]
(b) Human wants are unlimited in number. They are never ending and they can never be fully satisfied. Justify. [4 Marks]
Ans: (a)This problem involves selection of goods and services to be produced and the quantity to be produced for each selected commodity. Every economy has limited resources and thus, cannot produce all the goods. More of one good or service usually means less of others.
For example, production of more sugar is possible only by reducing the production of other goods. Production of more war goods is possible only by reducing the production of civil goods. So, on the basis of the importance of various goods, an economy has to decide which goods should be produced and in what quantities. This is a problem of allocation of resources among different goods.
(b)This problem is concerned with the distribution of income in an economy. It is concerned with whether to produce goods for high-income groups or low-income groups. The capacity of people to pay for goods depends upon their level of income. Thus, this problem is concerned with distribution of income among factors of production who contribute in the production process.
It has two aspects:
(i) Personal distribution: It means the national income of an economy distributed among different groups of people in the society.
(ii) Factorial distribution: It relates to in share of different factors of production as wages for labour, interest for capital for land, etc.
|
59 videos|222 docs|43 tests
|
FAQs on CBSE Class 11 Economics Sample Paper - 1 - Economics Class 11 - Commerce
| 1. What are the main topics covered in the CBSE Class 11 Economics syllabus? |  |
| 2. How can I effectively prepare for the CBSE Class 11 Economics exam? |  |
| 3. What is the importance of statistics in Economics as per the Class 11 syllabus? |  |
| 4. How are marks allocated in the CBSE Class 11 Economics exam? |  |
| 5. What are some common mistakes to avoid while answering Economics exam questions? |  |


