Central Limit Theorem & The Standard Error | UGC NET Commerce Preparation Course PDF Download
Central Limit Theorem and Standard Error
Introduction to Central Limit Theorem
The Central Limit Theorem is a fundamental concept in statistics that states that the sampling distribution of the sample mean approaches a normal distribution as the sample size gets larger, regardless of the shape of the population distribution.
Sampling Distribution
A sampling distribution is a probability distribution of a statistic obtained through a large number of samples drawn from a specific population. The Central Limit Theorem is closely related to the concept of a sampling distribution.
Key Points about Central Limit Theorem
- The Central Limit Theorem is essential in statistics as it allows us to make inferences about a population based on a sample.
- It is applicable to a wide range of statistical tests, making it a foundational concept in statistical analysis.
- Understanding the Central Limit Theorem is crucial for various fields such as hypothesis testing, confidence intervals, and regression analysis.
Role of Standard Error
The Standard Error is a measure of the statistical accuracy of an estimate. It quantifies the variability of sample statistics from multiple samples. A smaller standard error indicates that the sample statistic is more precise.
Importance of Standard Error
- The Standard Error is crucial in hypothesis testing and constructing confidence intervals.
- It helps in assessing the reliability of sample statistics and making informed decisions based on data.
- Understanding the Standard Error is essential for researchers and analysts to draw reliable conclusions from their data.
Sampling Distribution
Say we have a collection of used cars in a car shop, which represents the population we are interested in studying.
We aim to examine the prices of these cars and make predictions about them. Some key population parameters we might focus on include:
- Mean car price
- Standard deviation of prices
- Covariance
Drawing a Sample
Imagine we take a sample and find that the mean car price is $2,617.23. However, if we were to take another sample, we might end up with a different mean, like $3,201.34 or $2,844.33 for a third sample. This variability in means demonstrates that relying on a single value is not ideal.
Drawing Many Samples
Instead of focusing on individual samples, we can draw numerous samples and compile a new dataset composed of sample means. These means are distributed in a certain way, forming what we call a sampling distribution. In our context, we are specifically dealing with a sampling distribution of the mean.
This response provides a detailed and easy-to-understand explanation of the concept of a sampling distribution and the process of drawing samples to create a distribution of sample means.Understanding Distribution, Sampling Distribution, and Mean
- Distribution and Sampling Distribution: These concepts involve the spread of values and how samples are taken from a population.
- Population Mean: The central value around which data points revolve, often approximated by sample means.
- Approximation of Population Mean: Sample means provide estimates of the population mean, collectively offering a good idea despite individually not being the exact population mean.
- Precision of Approximation: The average of sample means provides a highly accurate estimate of the population mean.
Visualizing Distribution and Sampling Means
Here's a plot illustrating the distribution of car prices, showcasing a right-skewed distribution.

The Big Revelation: When we visualize the distribution of sampling means, we uncover a different and valuable perspective.
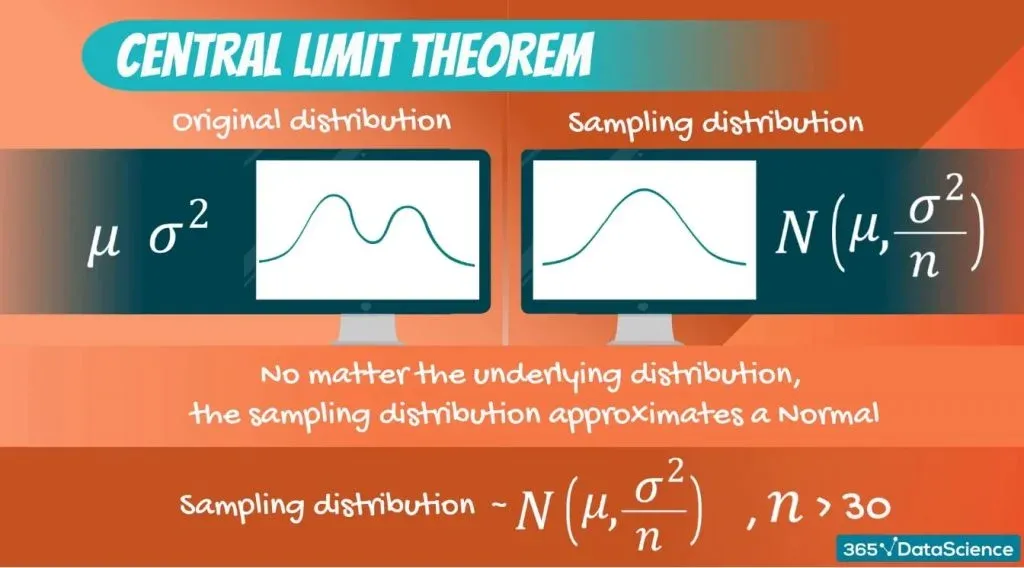
The Central Limit Theorem
- Distribution of Sampling Means: When samples are drawn from a normal distribution, the Central Limit Theorem comes into play.
- Sampling Distribution: The sampling distribution of the mean will approximate a normal distribution, regardless of the population's original distribution (Binomial, Uniform, Exponential, etc.).
- Mean: The mean of the sampling distribution will be equal to the population mean.
The Variance
- Variance: The variance of the sampling distribution depends on the sample size—it is the population variance divided by the sample size.
- Effect of Sample Size: As the sample size increases, the variance decreases, leading to a more accurate approximation.
- Sample Size Importance: Typically, a sample size of at least 30 observations is necessary for the Central Limit Theorem to be applicable.
Central Limit Theorem Importance and Application
Understanding the importance of the Central Limit Theorem is crucial in statistics. Here are the key points:
- Variance: The Central Limit Theorem is significant in dealing with variance.
- Why the Central Limit Theorem is Important:
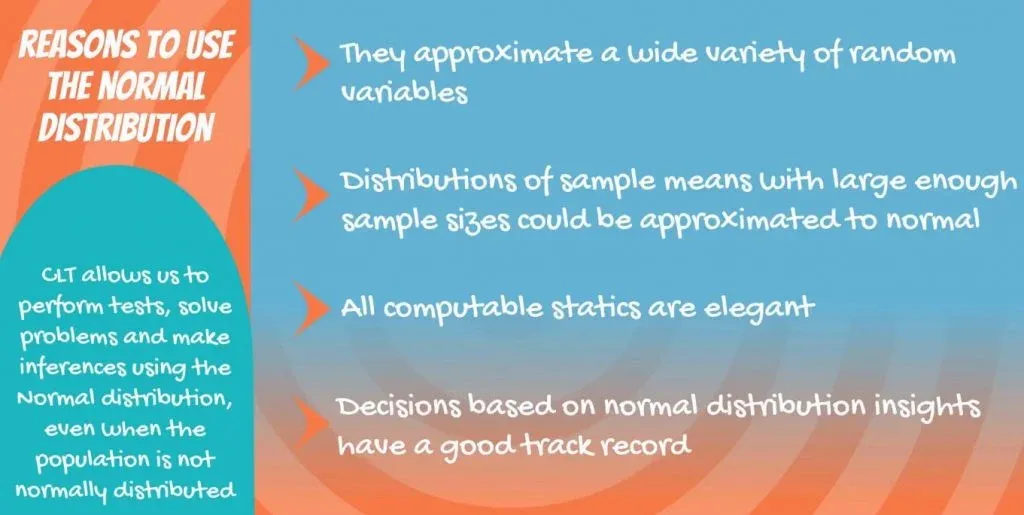
- The theorem allows us to use the normal distribution for tests, problem-solving, and making inferences, even when the population's distribution is not normal.
- Normal Distribution:
- The normal distribution offers elegant statistical properties and is highly applicable in calculating confidence intervals and conducting tests.
- Discovery and Impact:
- The discovery and validation of the Central Limit Theorem transformed the field of statistics, becoming a fundamental tool in subsequent statistical analyses.
Images for Reference
Below are the images that can help visualize the concepts:
Standard Error
Standard Error: The standard error is a crucial concept arising from the sampling distribution and closely linked to the Central Limit Theorem (CLT). It represents the standard deviation of the distribution formed by sample means.
Key Concepts: Standard deviation, distribution, sample means
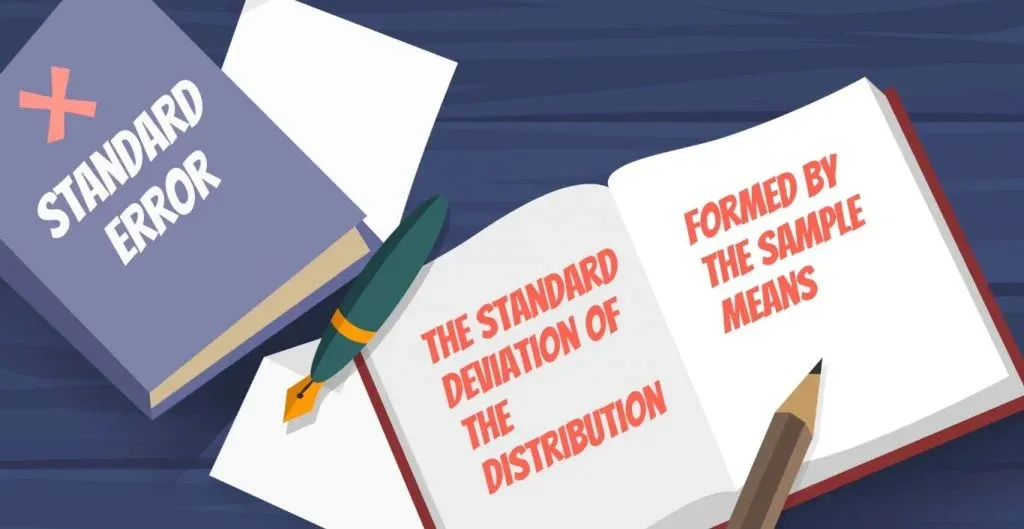
In simpler terms, the standard error is the standard deviation of the sampling distribution.
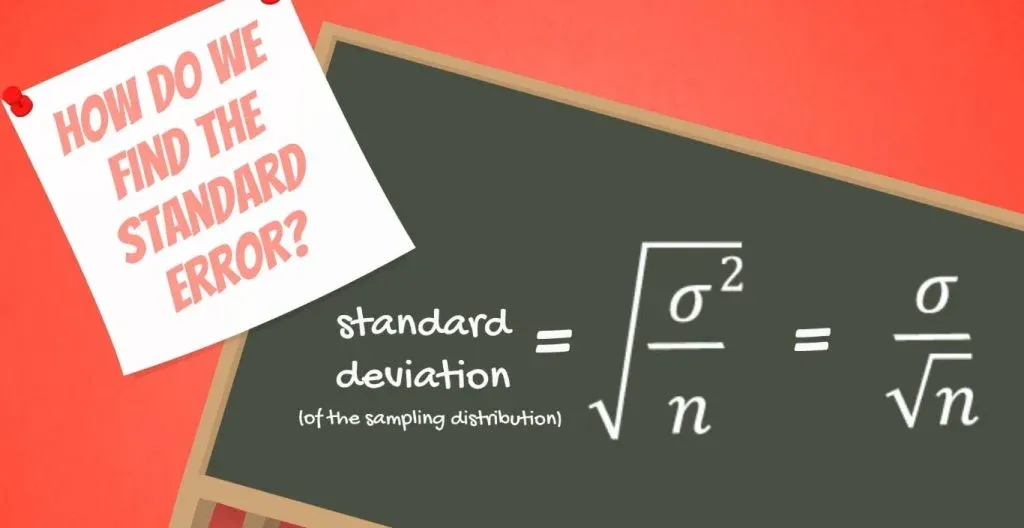
How to Calculate: To find the standard error, we use its variance: sigma squared divided by n. Therefore, the standard deviation is sigma divided by the square root of n.
Key Terms: Variance, sigma, n, standard deviation
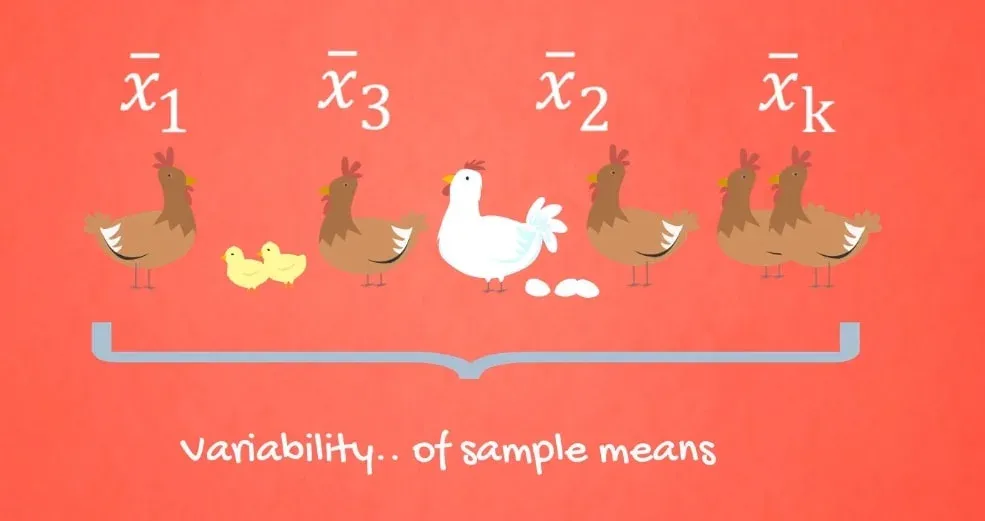
Similar to standard deviation, the standard error indicates variability. Specifically, it reflects the variability of the means of different extracted samples.
Why We Need It
Purpose: Standard error finds extensive application in statistical tests as a probabilistic measure that indicates how closely the true mean is approximated.
Key Terms: Standard error, mean This response provides a detailed overview of the concept of standard error, its calculation, significance, and application in statistical analysis. The content is presented in an educational format to facilitate understanding.Central Limit Theorem
The Central Limit Theorem is a fundamental concept in statistics. It asserts that regardless of the initial distribution of a dataset, the distribution of sample means will tend towards a normal distribution. Furthermore, the mean of this distribution will mirror the original mean of the dataset. However, the variance of the sample means will be the original variance divided by the sample size.
Key Points of the Central Limit Theorem:
- No matter the original distribution, sample means will follow a normal distribution.
- The mean of the sample means matches the mean of the original dataset.
- The variance of the sample means is the original variance divided by the sample size.
What's Next
If you wish to delve deeper into statistics, understanding the concept of estimators is crucial. Estimators play a vital role in statistical inference, helping us draw conclusions about populations based on sample data. To explore this further, consider reviewing our tutorial on estimators.
Interested in advancing your statistical skills? Enhance your expertise by enrolling in our comprehensive statistics course, designed to elevate your proficiency from good to exceptional.
Prepare yourself for the next tutorial, which will focus on the practical application of point estimates and confidence intervals in statistical analysis.
Data Science Courses by Iliya Valchanov
Iliya Valchanov is the co-founder of 365 Data Science, a platform offering a variety of courses in mathematics, statistics, machine learning, and deep learning. Let's explore some of the key topics covered in these courses.
Introduction to Data Science
Mathematics in Data Science
Machine Learning
Deep Learning
Statistics Tutorials by Iliya Valchanov
Iliya Valchanov also provides in-depth tutorials on various statistical topics. Let's take a look at some of these tutorials.
Introduction to the Measures of Central Tendency
Measures of Variability: Coefficient of Variation, Variance, and Standard Deviation
Measures of Variability
Measures of variability in statistics help us understand the spread or dispersion of data points within a dataset. Key measures include the Coefficient of Variation, Variance, and Standard Deviation.
Coefficient of Variation
The Coefficient of Variation (CV) is a relative measure of variability that indicates the ratio of the standard deviation to the mean of a dataset, expressed as a percentage. It is used to compare the dispersion of data sets with different units or scales.
Variance
Variance is a measure that quantifies the spread of numbers in a dataset. It is calculated as the average of the squared differences from the mean. A high variance indicates that the data points are spread out over a large range, while a low variance suggests that the data points are clustered closely around the mean.
Standard Deviation
The Standard Deviation is a measure of the dispersion of data points around the mean in a dataset. It is the square root of the variance and provides a more interpretable understanding of how spread out data points are relative to the mean.
Statistics Tutorials
Obtaining Standard Normal Distribution Step-By-Step
Understanding the standard normal distribution is crucial in statistics. This tutorial provides a step-by-step guide on how to obtain and work with the standard normal distribution, which is a normal distribution with a mean of 0 and a standard deviation of 1.
Calculating and Using Covariance and Linear Correlation Coefficient
Covariance and the Linear Correlation Coefficient are measures used to assess the relationship between two variables in a dataset. Covariance measures how two variables change together, while the correlation coefficient standardizes this measure to a range between -1 and 1, indicating the strength and direction of the relationship.
GET World-Class Data Science Courses
For those looking to enhance their data science skills, enrolling in world-class data science courses can provide valuable knowledge and practical experience. Learning from experienced instructors can help individuals gain a strong foundation in data science concepts and techniques.
Please note that the provided response paraphrases the content and presents it in an educational format.|
235 docs|166 tests
|


