Chapter 14 - Statistics, Solved Examples, Class 9, Maths | Extra Documents & Tests for Class 9 PDF Download
INTRODUCTION
In various fields, we need information in the form of numerical figures called data.
These data may relate to the marks obtained by the pupils of a class in a certain examination; the weights, heights, ages, etc., of pupils in a class; the monthly wages earned by workers in a factory; the population of a town or the profits of a company during last few years, etc.
Evaluation of such data helps analysts study the various growth patterns and formulate future targets or policies or derive certain inferences.
STATISTICS
It is the science which deals with the collection, presentation, analysis and interpretation of numerical data.
In singular form, statistics is taken as a subject. And, in plural form, statistics means data.
DATA
The word data means a set of given facts in numerical figures.
Fundamental Characteristics of Data
(i) Numerical facts alone form data. Qualitative characteristics, like honesty, poverty, etc., which cannot be measured numerically do not form data.
(i) Data are aggregate of facts. A single observation does not form data.
(ii) Data collected for a definite purpose may not be suitable for another purpose.
Types of Data
(i) Primary Data : The data collected by the investigator himself with a definite plan in mind are known as primary data.
(ii) Secondary Data : The data collected by someone, other than the investigator, are known as secondary data.
VARIABLE
A quantity which can take different values is called a variable.
Ex : Height, Age and Weight of pupils in a class are three variables.
If we denote them by x, y and z respectively, then values of x give the heights of the pupils; the values of y give the ages of the pupils and the values of z give the weights of the pupils.
Continuous and Discrete Variables
Variables are of 2 types
1. Continuous Variable : A variable which can take any numerical value within a certain range is called a continuous variable.
Ex.
(i) Wages of workers in a factory
(ii) Heights of children in a class
(iii) Weights of persons in a group etc.
2. Discontinuous (or Discrete) Variable : A variable which cannot take all possible values between two given values, is called a discontinuous or discrete variable.
Ex.
(i) Number of members in a family
(ii) Number of workers in a factory
Such variables cannot take any value between 1 and 2, 2 and 3, etc.
IMPORTANT TERMS
Range : The difference between the maximum and minimum values of a variable is called its range.
Variate : A particular value of a variable is called variate.
Presentation of Data : Putting the data in condensed form in the form of a table, is known as presentation of data.
Frequency : The number of times an observation occurs is called its frequency.
Frequency Distribution : The tabular arrangement of data showing the frequency of each observation is called its frequency distribution.
RAW OR UNGROUPED DATA
The data obtained in original form are called raw data or ungrouped data.
Ex. The marks obtained by 25 students in a class in a certain examination are given below:
25, 8, 37, 16, 45, 40, 29, 12, 42, 40, 25, 14, 16, 16, 20, 10, 36, 33, 24, 25, 35, 11, 30, 45,48.
This is the raw data.
Array : An arrangement of raw data in ascending or descending order of magnitude is called an array.
Arranging the marks of 25 students in ascending order, we get the following array.
8, 10, 11, 12, 14, 16, 16, 16, 20, 24, 25, 25, 25, 29, 30, 33, 35, 36, 37, 40, 40, 42, 45, 45, 48.
TO PREPARE A FREQUENCY DISTRIBUTION TABLE FOR RAW DATA USING TALLY MARKS
We take each observation from the data, one at a time, and indicate the frequency (the number of times the observation has occurred in the data) by small lines, called tally marks. For convenience, we write tally marks in bunches of five, the fifth one crossing the fourth diagonally. In the table so formed, the sum of all the frequencies is equal to the total number of observations in the given data.
Ex. The sale of shoes of various sizes at a shop, on a particular day is given below:

The above data is clearly raw data.
From this data, we may construct a frequency table, as given below :
Frequency Table
Size | Tally Marks | Frequeucy |
4 | II | 2 |
5 |
| 5 |
6 |
| 4 |
7 |
| 4 |
S |
| 6 |
9 |
| 7 |
Total |
| 28 |


To put the data in a more condensed form, we make groups of suitable size, and mention the frequency of each group.
Such a table is called a grouped frequency distribution table.
GROUPED DATA
To put the data in a more condensed form, we make groups of suitable size, and mention the frequency of each group.
Such a table is called a grouped frequency distribution table.
Class-Interval : Each group into which the raw data is condensed, is called a class-interval. Each class is bounded by two figures, which are called class limits. The figure on the left side of a class is called its lower limit and that on its right is called its upper limit.
Types of Grouped Frequency Distribution
1. Exclusive Form (or Continuous Interval Form) : A frequency distribution in which the upper limit of each class is excluded and lower limit is included, is called an exclusive form.
Ex. Suppose the marks obtained by some students in an examination are given.
We may consider the classes 0 – 10, 10 – 20 etc. In class 0 – 10, we include 0 and exclude 10. In class 10 - 20, we include 10 and exclude 20.
2. Inclusive Form (or Discontinuous Interval Form) : A frequency distribution in which each upper limit as well as lower limit is included, is called an inclusive form. Thus, we have classes of the form 0 – 10, 11 – 20, 21 – 30 etc. In 0 – 10, both 0 and 10 are included.
Ex.1 Given below are the marks obtained by 40 students in an examination :
3, 25, 48, 23, 17, 13, 11, 9, 46, 41, 37, 45, 10, 19, 39, 36, 34, 5, 17, 21, 39, 33, 28, 25, 12, 3, 8, 17, 48, 34, 15, 19, 32, 32, 19, 21, 28, 32, 20, 23.
Arrange the data in ascending order and present it as a grouped data in :
(i) Discontinuous Interval form, taking class-intervals 1 – 10, 11 – 20, etc.
(ii) Continuous Interval form, taking class-intervals 1 – 10, 10 – 20, etc.
Sol. Arranging the marks in ascending order, we get:
3, 3, 5, 8, 9, 10, 11, 12, 13, 15, 17, 17, 17, 19, 19, 19, 20, 21, 21, 23, 23, 25, 25, 28, 28, 32, 32, 32, 33, 34, 34, 36, 37, 39, 39, 41, 45, 46, 48, 48.
We may now classify them into groups as shown below:
(i) Discontinuous Interval Form (or Inclusive Form)
Marks (Class-intervals) | Tally Marks | Number of Students (frequency) |
1-10 |
| 6 |
11-20 |
| 11 |
21-30 |
| S |
31-40 |
| 10 |
41-50 |
| 5 |
Total |
| 40 |


Note that the class 1 – 10 means, marks obtained from 1 to 10, including both.
(ii) Continuous Interval Form (or Exclusive Form)
Marks (Class-intervals) | Tally Marks | Number of Students (frequency) |
1-10 |
| 5 |
10-20 |
| 11 |
20-30 |
| 9 |
30-40 |
| 10 |
40-50 |
| 5 |
Total |
| 40 |
Here, the class 1 – 10 means, marks obtained from 1 to 9, i.e., excluding 10.
IMPORTANT TERMS RELATED TO GROUPED DATA
1. Class Boundaries Or True Upper And True Lower Limits :
(i) In the exclusive form, the upper and lower limits of a class are respectively known as the true upper limit and true lower limit.
(ii) In the inclusive form, the number midway between the upper limit of a class and lower limit of the subsequent class gives the true upper limit of the class and the true lower limit of the subsequent class ..
Thus, in the above table of inclusive form, we have :
true upper limit of class 1 – 10 is  = 10.5, and, true lower limit of class 11 – 20 is 10.5.
Similarly, true upper limit of class 11 – 20 is  = 20.5, and, true lower limit of class 21 – 30 is 20.5.
2. Class Size : The difference between the true upper limit and the true lower limit of a class is called its class size.
3. Class Mark of A Class =
The difference between any two successive class marks gives the class size.
Ex.2 The class marks of a frequency distribution are 7, 13, 19, 25, 31, 37, 43. Find the class-size and all the class-intervals.
Sol. Class size = Difference between two successive class-marks = (13 – 7) = 6.
Let the lower limit of the first class interval be a. Then, its upper limit = (a + 6).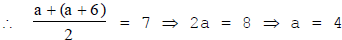
So, the first class-interval is 4 – 10.
Let the lower limit of last class-interval be b.
Then, its upper class limit = (b + 6).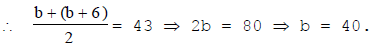
So, the last class-interval is 40 – 46.
Hence, the required class-intervals are 4 – 10, 10 – 16, 16 – 22, 22 – 28, 28 – 34, 34 – 40 and 40 – 46.
METHOD OF FORMING CLASSES OF A DATA
1. Determine the maximum and minimum values of the variate occurring in the data.
2. Decide upon the number of classes to be formed.
3. Find the range, i.e., the difference between the maximum value and the minimum value. Divide the range by the number of classes to be formed to get the class-size.
4. Be sure that there must be classes having minimum and maximum values occurring in the data.
5. By counting, we obtain the frequency of each class.
Ex.3 The water tax bills (in rupees) of 30 houses in a locality are given below :
147, 167, 136, 178, 175, 116, 155, 121, 115, 156, 176, 141, 189, 167, 177, 208, 212, 143, 203, 210, 188, 178, 212, 118, 197, 145, 134, 133, 196, 185.
Construct a frequency-distribution table with class-size 10.
Sol. Minimum observation = 115, Maximum observation = 212.
Range = (Maximum observation) – (Minimum observation) = (212 – 115) = 97.
Class size = 10.
Since 97 ÷ 10 = 9.7 , we should have 10 classes, each of size 10. These classes are:
115 – 125, 125 – 135, 135 – 145, 145 – 155, 155 – 165, 165 – 175, 175 – 185, 185 – 195, 195 – 205 and 205 – 215.
∴ The frequency distribution table may be presented as shown below :
Bill (iu Rs) | Tally Marks | Frequency |
115-125 | IIII | 4 |
125-135 | II | 2 |
135-145 | III | 3 |
145-155 | II | 2 |
15 5-165 | II | 2 |
165-175 | II | 2 |
175-185 |
| 5 |
185-195 | IIII | 4 |
195-205 | III | 3 |
205-215 | III | 3 |
Total |
| 30 |

RULE TO CONVERT DISCONTINUOUS (OR INCLUSIVE) FORM TO CONTINUOUS (OR EXCLUSIVE) FORM
In a discontinuous interval or inclusive form, we have :
Adjustment factor = 1/2 [(Lower limit of one class – Upper limit of previous class)]
Thus, if the classes are 1 – 10, 11 – 20, etc., then adjustment factor = 1/2 (11 – 10) = 0.5.
To convert data given in discontinuous form to the continuous form, we subtract the adjustment factor from each lower limit and add the adjustment factor to each upper limit to get the true limits.
Ex. 4 Convert the following frequency distribution from discontinuous to continuous form:
Marks (Class-intervals) | Frequency |
1-10 | 7 |
11-20 | 5 |
21-20 | 9 |
31-40 | 11 |
41-50 | 6 |
Sol. Adjustment factor =1/2 (11 – 10) = 0.5. Subtract 0·5 from each lower limit and add 0·5 to each upper limit.
Then, the required table in continuous form may be prepared as under :
Marks (before adjustment) | Marks (after adjustment) | Frequency |
1-10 | 0.5-10.5 | 7 |
11-20 | 10.5-20.5 | 5 |
21-30 | 20.5-30.5 | 9 |
31-40 | 30.5-40.5 | 11 |
41-5 0 | 40.5-50.5 | 6 |
Total |
| 38 |
CUMULATIVE FREQUENCY OF A CLASS-INTERVAL
The sum of the frequencies of all the previous classes and that particular class, is called the cumulative frequency of the class.
Cumulative Frequency Table
A table which shows the cumulative frequencies over various classes is called a cumulative frequency distribution table.
Ex.5 Following are the ages (in years) of 360 patients, getting medical treatment in a hospital.
Age (in years) | 10-20 | 20-30 | 30-40 | 40-50 | 50-60 | 60-70 |
Number of Patients | 90 | 50 | 60 | 80 | 50 | 30 |
Construct the cumulative frequency table for the above data.
Sol. The cumulative frequency table for the above data is given below.
Class interval | 10-20 | 20-30 | 30-40 | 40-50 | 50-60 | 60-70 |
Frequency | 90 | 50 | 60 | 80 | 50 | 30 |
Cumulative Frequency | 90 | 140 | 200 | 280 | 330 | 360 |
This table may be presented in 'less than form', as under.
Age (in years) | Number of Patients |
Less than 20 | 90 |
Less than 30 | 140 |
Less than 40 | 200 |
Less than 50 | 280 |
Less than 60 | 330 |
Less than 70 | 360 |
Ex.6 The monthly wages (in rupees) of 28 labourers working in a factory, are given below .-
220, 268, 258, 242, 210, 267, 272, 242, 311, 290, 300, 320, 319, 304, 302, 292, 254, 278, 318, 306, 210, 240, 280, 316, 306, 215, 256, 328.
Form a cumulative frequency table with class intervals of length 20.
Sol. We may form the table as under :
Class interval | Tally Marks | Frequency | Cumulative Frequency |
210-230 | llll | 4 | 4 |
230-250 | III | 3 | 7 |
250-270 |
| 5 | 12 |
270-290 | III | 3 | 15 |
290-310 |
| 7 | 22 |
310-330 |
| 6 | 28 |


GRAPHICAL REPRESENTATION OF STATISTICAL DATA
The tabular representation of data is an ideal way of presenting them in a systematic manner. When these numerical figures are represented pictorially or graphically, they become more noticeable and easily intelligible, leaving a more lasting effect on the mind of the observer. With the help of these pictures or graphs, data can be compared easily.
There are various types of graphs. In this chapter, we shall be dealing with the following graphs:
1. Bar Graphs
2. Histogram
3. Frequency Polygon
BAR GRAPH (OR COLUMN GRAPH OR BAR CHART)
A bar graph is a pictorial representation of numerical data in the form of rectangles (or bars) of equal width and varying heights.
These rectangles are drawn either vertically or horizontally.
The height of a bar represents the frequency of the corresponding observation.
The gap between two bars is kept the same.
Ex.7 The following table shows the number of students participating in various games in a school.
Cricket | Tenuis | Football | Badminton |
27 | 9 | 18 | 12 |
Draw a bar graph to represent the above data.
Sol. Take the games along x-axis and the number of students along Y-axis.
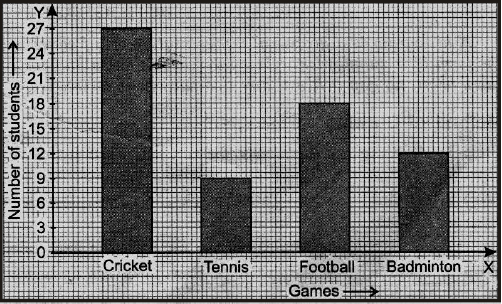
Along y-axis, take the scale 1 cm = 6 students.
The bar-graph may, thus, be drawn as shown alongside.
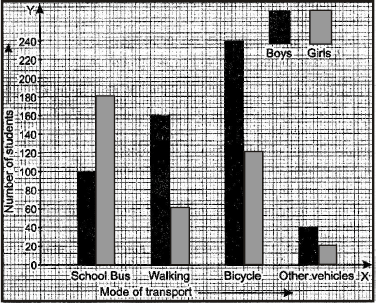
Ex.8 Given below are data showing number of students of a school using different modes of travel to school.
Mode | School Bus | Walking | Bicycle | Other Vehicles |
No. of Boys | 100 | 160 | 240 | 40 |
No. of Girls | 180 | 60 | 120 | 20 |
Draw a bar graph to represent the above data.
Sol. Take the mode along x-axis and the number of students along y-axis.
Scale : Along y-axis, take 1 cm = 40 students.
The bars of equal width and proportionate heights with same gap between the two consecutive bars, may be drawn as shown below.
Shading for boys and girls may be done as under :
HISTOGRAM
A histogram is a graphical representation of a frequency distribution in an exclusive form in the form of rectangles with class intervals as bases and the corresponding frequencies as heights, there being no gap between any two successive rectangles.
METHOD OF DRAWING A HISTOGRAM
Step 1 : If the given frequency distribution is in inclusive form, convert it into an exclusive form.
Step 2 : Taking suitable scales, mark the class-intervals along x-axis and frequencies along y-axis.
Note that the scales chosen for both the axes need not be the same.
Step 3 : Construct rectangles with class-intervals as bases and the corresponding frequencies as heights.
Ex.9 Draw a histogram to represent the following data :
Class interval | 30-36 | 3642 | 42-48 | 48-54 | 54-60 |
Frequency | 15 | 25 | 20 | 30 | 10 |
Sol. Draw rectangles with bases 30 – 36, 36 – 42, 42 – 48, 48 – 54 and 54 – 60 and heights 15, 25, 20, 30 and 10 respectively.
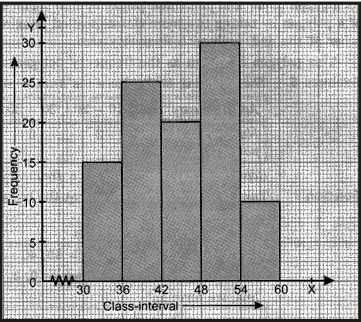
Note : Since the scale on x-axis starts at 30, we make a kink ( ) in the beginning.
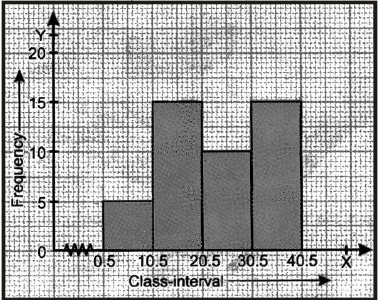
Ex.10 Draw a histogram for the following data :
Class interval | 1-10 | 11-20 | 21-30 | 31-40 |
Frequency | 5 | 15 | 10 | 15 |
Sol. The given table is in inclusive-form. So, we first convert it into an exclusive form, as given below.
Class interval | 0.5-10.5 | 10.5-20.5 | 20.5-30.5 | 3 0.5-40.5 |
Frequency | 5 | 15 | 10 | 15 |
Now, we may draw the histogram, as shown below.
Note : Since the scale on x-axis starts at 0.5, a kink is shown near the origin.
|
1 videos|228 docs|21 tests
|
FAQs on Chapter 14 - Statistics, Solved Examples, Class 9, Maths - Extra Documents & Tests for Class 9
| 1. What are statistics and why are they important in mathematics? |  |
| 2. How can statistics be useful in everyday life? | |
| 3. What are some common measures of central tendency in statistics? | |
| 4. How can statistics be used to analyze and interpret data? | |
| 5. How can statistics help in decision making? | |

|
4.4K Views |

|
4.71/5 Rating |

|
Dec 23, 2024 Last updated |

|
Explore Courses for Class 9 exam
|
|
Solved Examples
,Solved Examples
,practice quizzes
,shortcuts and tricks
,Previous Year Questions with Solutions
,Exam
,past year papers
,Sample Paper
,Free
,ppt
,Class 9
,Important questions
,study material
,Class 9
,Maths | Extra Documents & Tests for Class 9
,Summary
,Chapter 14 - Statistics
,Semester Notes
,Chapter 14 - Statistics
,Viva Questions
,Solved Examples
,Extra Questions
,Maths | Extra Documents & Tests for Class 9
,Chapter 14 - Statistics
,mock tests for examination
,Objective type Questions
,Class 9
,Maths | Extra Documents & Tests for Class 9
,MCQs
,video lectures
;


Chapter 14 - Statistics, Solved Examples, Class 9, Maths Free PDF Download
Importance of Chapter 14 - Statistics, Solved Examples, Class 9, Maths
Chapter 14 - Statistics, Solved Examples, Class 9, Maths Notes
Chapter 14 - Statistics, Solved Examples, Class 9, Maths Class 9 Questions
Study Chapter 14 - Statistics, Solved Examples, Class 9, Maths on the App
|
© EduRev
|
Education Revolution
|


|


