Class 4 Maths - Data Handling - CBSE Worksheets
| Table of contents |

|
| Multiple Choice Questions |

|
| Short Questions |

|
| Fill in the Blanks |

|
| Match the Column |

|
| True or False |

|
Multiple Choice Questions
Q1: What does data handling mean?
(a) Collecting and presenting data in different forms
(b) Analyzing and interpreting data
(c) Storing and securing data
(d) Creating graphs and charts
Ans: (a)
Data handling refers to the process of collecting data and presenting it in various forms such as tables, graphs, or charts.
Q2: Which of the following is an example of qualitative data?
(a) Height of students in a class
(b) Number of books in a library
(c) Types of fruits in a basket
(d) Temperature readings over a week
Ans: (c)
Qualitative data provides descriptive information and can include categories or types, such as the different types of fruits in a basket.
Q3: Discrete data can take which of the following values?
(a) Any real number
(b) Only whole numbers
(c) Numbers within a range
(d) Both whole numbers and decimal numbers
Ans: (b)
Discrete data consists of distinct values and can only take certain values, typically whole numbers, and not decimal or fractional values.
Q4: What is the fourth step in the data handling process?
(a) Problem Identification
(b) Data Collection
(c) Data Presentation
(d) Graphical Representation
Ans: (c)
After collecting data, the next step is to present it in a meaningful manner so that it can be easily understood and analyzed.
Q5: Which of the following is a graphical representation of data?
(a) Frequency Distribution
(b) Cumulative Tables
(c) Stem and Leaf Plot
(d) Pictographs
Ans: (d)
Pictographs are graphical representations of data using pictures or symbols to represent quantities or categories.
Short Questions
Q1: Define qualitative data and provide an example.Ans: Qualitative data provides descriptive information about something. For example, the colors of cars in a parking lot or the types of animals in a zoo are examples of qualitative data.
Q2: Explain the steps involved in the data handling process.
Ans: The steps involved in the data handling process are as follows:
- Problem Identification: Clearly define the purpose or problem statement.
- Data Collection: Gather relevant data related to the problem statement.
- Data Presentation: Organize and present the collected data in a meaningful way, such as through tables or graphs.
- Graphical Representation: Create visual representations of the data using graphs, charts, or diagrams.
- Data Analysis: Analyze the data to draw conclusions, identify patterns, or make comparisons.
- Conclusion: Based on the analysis, derive a solution or draw meaningful insights from the data.
Q3: How can data be represented using a bar graph? Provide an example.
Ans: To represent data using a bar graph, follow these steps:
- Identify the categories or variables to be represented on the graph.
- Choose an appropriate scale for the axes (usually the x-axis represents the categories and the y-axis represents the values).
- Draw bars of equal width for each category, with the height or length of the bars representing the corresponding values.
- Label the axes and provide a title for the graph.
Q4: What is the difference between discrete data and continuous data?
Ans: Discrete data consists of distinct values that cannot be further divided. For example, the number of siblings a student has or the number of books on a shelf are discrete data. Continuous data, on the other hand, can take any value within a range. For example, the height or weight of a person can be continuous data as it can have decimal or fractional values.
Q5: Name three different methods to represent data.
Ans: Three different methods to represent data are:
- Bar Graphs: These use rectangular bars of equal width to represent categories or variables, with the length of the bars proportional to the values.
- Line Graphs: These use lines to show the relationship between two variables, typically with time represented on the x-axis.
- Pictographs: These use pictures or symbols to represent quantities or categories, with each picture representing a specific value or quantity.
Fill in the Blanks
1. Data handling involves collecting data and presenting it in a __________ form.
Ans: different
2. Qualitative data provides __________ information.
Ans: descriptive
3. Discrete data can take only __________ values.
Ans: certain
4. The steps involved in the data handling process include problem identification, data collection, data presentation, __________ representation, data analysis, and conclusion.
Ans: graphical
5. A bar graph represents data using __________ bars.
Ans: rectangular
Match the Column
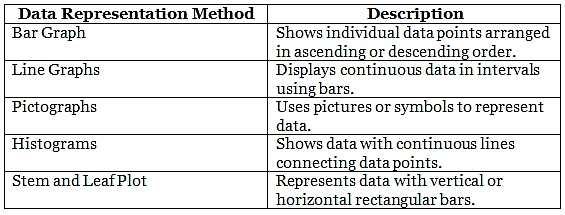
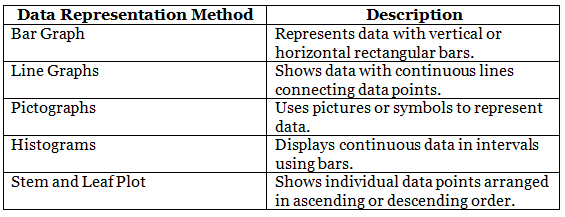
Match the data representation method with its description.

Ans:

True or False
1. Data handling involves presenting data in different forms. (True/False)
Ans: True
2. Qualitative data gives numerical information. (True/False)
Ans: False
3. Discrete data can take any value within a given range. (True/False)
Ans: False
4. Graphical representation of data is not necessary in the data handling process. (True/False)
Ans: False
5. Bar graphs are used to compare quantities. (True/False)
Ans: True
|
32 videos|39 docs|46 tests
|

|
Explore Courses for Class 4 exam
|

|


