Comparing data | Year 4 Mathematics PDF Download
How can we compare data?
Tables, pictograms, and bar charts are effective tools to compare and analyze data.
Tables
Tables use numbers. This table shows you the amount of flowers that were planted in a garden.
By looking at the table, you can easily compare the numbers.
Let's use the table to answer some questions:
(i) Which flower was planted the most?
Ans: For this question, you look for the largest value in the column titled 'Amount planted' .
You can see that the pansy was planted the most.
(ii) How many more roses were planted than daffodils?
Ans: This question is asking you to find the difference between the two results.
Look at the table again. You need to subtract the number of daffodils (67) from the number of roses (89).
89 – 67 = 22
So there were 22 more roses planted than daffodils.
Pictograms
A pictogram uses pictures or symbols to represent data.
Number of points collected by each group in the class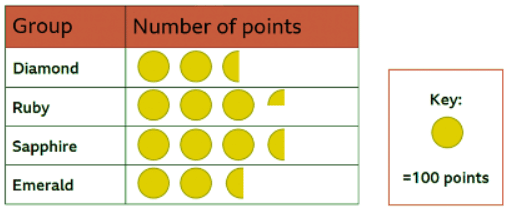
The key shows that one whole circle represents 100 points. This helps you to work out how many points were awarded to each team.
A semi-circle must represent 50 points since it’s half of the whole, and a quarter-circle must show 25 points.
(i) How many more points did Sapphire win than Ruby?
Ans: This is another subtraction question. Sapphire was awarded 350 points and Ruby have 325 points.
350 - 325 = 25 points
So Sapphire was awarded 25 points more than Ruby.
(ii) How many points did Diamond and Emerald get altogether?
Ans: The word “altogether” means addition. Both houses have 250 points.
250 + 250 = 500 points
So Diamond and Emerald got 500 points altogether
Bar charts
A bar chart is another visual way to represent data. The heights of the bars let you automatically see the difference in results.
Class 4's favourite sports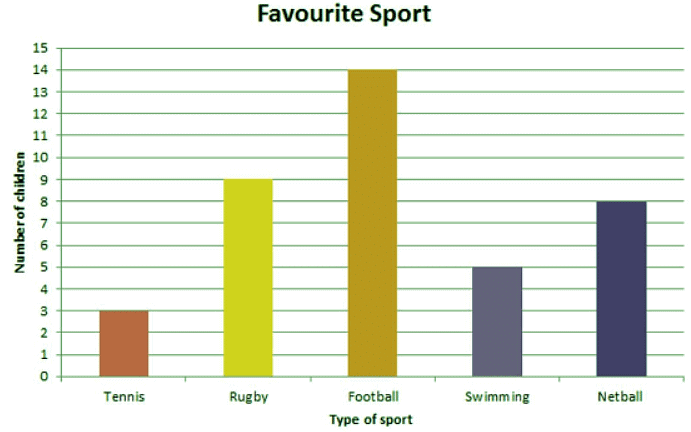 Using the bar chart above, you can quickly see that football was the most popular sport and tennis was the least popular.
(i) Which two sports had a difference of 4 children?
Ans: Work out how many children chose each sport and then find the two numbers with a difference of 4.
9 - 5 = 4
Rugby and swimming had a difference of 4 children.
(ii) How many children were asked about their favourite sport altogether?
Ans: For this question, add up all the results.
3 + 9 + 14 + 5 + 8 = 39
|
69 videos|70 docs|11 tests
|
FAQs on Comparing data - Year 4 Mathematics
| 1. How can data be displayed in UK schools? |  |
| 2. What are some common ways in which UK schools compare data? | |
| 3. How do UK schools ensure that data displayed is meaningful and relevant? | |
| 4. What are some challenges that UK schools face when displaying data? | |
| 5. How can UK schools effectively communicate data to parents and students? | |

|
Dec 22, 2024 Last updated |

|
Explore Courses for Year 4 exam
|
|
Summary
,Comparing data | Year 4 Mathematics
,practice quizzes
,Comparing data | Year 4 Mathematics
,MCQs
,Sample Paper
,Extra Questions
,Comparing data | Year 4 Mathematics
,shortcuts and tricks
,video lectures
,Semester Notes
,mock tests for examination
,Free
,ppt
,past year papers
,Objective type Questions
,Previous Year Questions with Solutions
,Important questions
,Exam
,study material
,Viva Questions
;


Comparing data Free PDF Download
Importance of Comparing data
Comparing data Notes
Comparing data Year 4 Questions
Study Comparing data on the App
|
© EduRev
|
Education Revolution
|


|


