Data Handling and Pictographs | Mathematics Olympiad for Class 1 PDF Download
What is data?
The data is a collection of information such as numbers, observations, words, facts, or pictures.
For Example: The number of fruits sold in a day or how many chocolates you ate today.
What is data handling?
- Data Handling is the process of gathering, organising, sorting, and representing data in a meaningful way.
- Let us understand with the help of an example.
- Look at the table below.
- The table shows the number of cars sold in a day.

- After representing the data in a meaningful way, we find information from the data.
- From the above table, we can see that Red cars are sold the most and black cars are sold the least.
Sorting and Organising data
After collecting the data, we sort and organise data.
(i) What is sorting?
Sorting is the process of grouping like objects or objects with similar features together.
(ii) What is organising?
- Organising is the process of classifying objects in a systematic manner to make them more usable.
- Let us understand with the help of an example.

- Look at the pictures of two cupboards, cupboard A and cupboard B.
Which cupboard looks neat and clean?
Cupboard B looks neat and clean as all the things are sorted and organised whereas in cupboard A all the things are messed up.
Riya and her friends want to make their school project. They want to purchase some items for their project. They prepare a list of various items which they need. The table given below shows the list of items and the quantity required. This list helps Riya and her friends to remember all the items they have to purchase.

Sorting and organising help in understanding the data in a better way.
Sorting, organising and representing data can be done with the help of various data handling methods.
Representing Data
- Data can be represented in the form of tables, picture graphs, etc.
- You have already studied the examples above in which data is represented in the form of tables. Now let us learn about picture graphs.
What is a picture graph?
- A picture graph represents data using symbols and pictures. It makes information easy and clear to understand. A picture graph is also known as a pictograph.
- Let us understand with the help of an example.
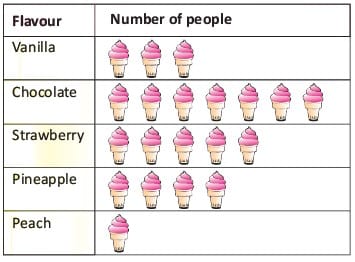
- Priya interviews 20 people and asks them about their favourite ice cream flavour. She represents the gathered information using a pictograph.
 From the pictograph, we see that chocolate flavour ice cream is the favourite of most people, and peach flavour ice cream is the least favourite.
|
15 videos|27 docs|51 tests
|
FAQs on Data Handling and Pictographs - Mathematics Olympiad for Class 1
| 1. What is data? |  |
| 2. What is data handling? |  |
| 3. How is data represented using pictographs? |  |
| 4. What are the advantages of using pictographs in data handling? |  |
| 5. How can data handling and pictographs be helpful in everyday life? |  |

|
Explore Courses for Class 1 exam
|

|


 From the pictograph, we see that chocolate flavour ice cream is the favourite of most people, and peach flavour ice cream is the least favourite.


