Mathematics Exam  >  Mathematics Notes  >  Mathematics for IIT JAM, GATE, CSIR NET, UGC NET  >  Descriptive statistics - Statistics, CSIR-NET Mathematical Sciences

Descriptive statistics - Statistics, CSIR-NET Mathematical Sciences | Mathematics for IIT JAM, GATE, CSIR NET, UGC NET PDF Download

The subject of statistics is broadly divided into two branches: Descriptive Statistics and Inferential Statistics. Descriptive Statistics deals with data collection and summarizing the raw data in an understandable format, and these results are generalized to arrive at a conclusion applying Inferential Statistics. The description or summary of sample behavior, presented using Descriptive Statistics is alone is in turn used for drawing inferences on the Population characteristics. Descriptive Statistics comes into play again in the presentation of the estimated or generalized Population traits.
Descriptive statistics - Statistics, CSIR-NET Mathematical Sciences | Mathematics for IIT JAM, GATE, CSIR NET, UGC NETThe data that is summarized in tabular, graphical or numerical form is also known an descriptive statistics.

Descriptive Statistics:
Descriptive Statistics deals with analysis and methods related to collection, organization, summarizing and presentation of data.
Applying the techniques of descriptive statistics, the raw data is collected and transformed into a meaningful form.

Key Concepts in Descriptive Statistics

1. Measures of Central Tendency:

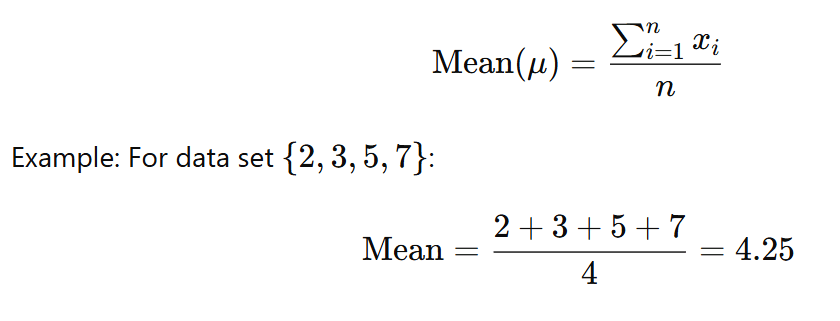
Mean (Arithmetic Average): The sum of all data values divided by the number of values. 
Descriptive statistics - Statistics, CSIR-NET Mathematical Sciences | Mathematics for IIT JAM, GATE, CSIR NET, UGC NET

Median: The middle value when data is ordered from least to greatest. For even number of values, it is the average of the two middle numbers. 
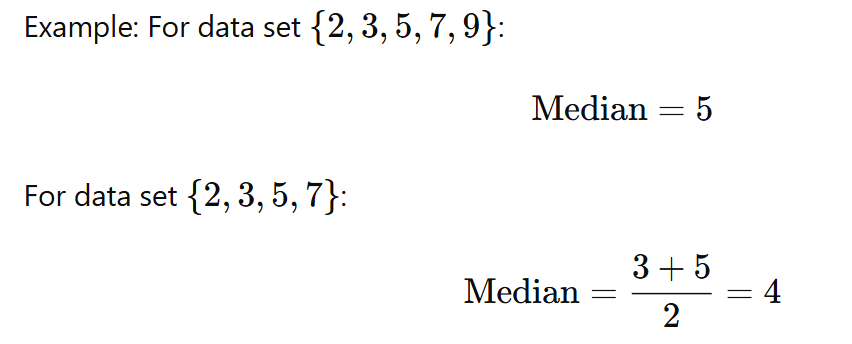
Descriptive statistics - Statistics, CSIR-NET Mathematical Sciences | Mathematics for IIT JAM, GATE, CSIR NET, UGC NET Mode: The value that appears most frequently in a data set.

Descriptive statistics - Statistics, CSIR-NET Mathematical Sciences | Mathematics for IIT JAM, GATE, CSIR NET, UGC NET

2. Measures of Dispersion:

Range: The difference between the maximum and minimum values in the data set.

Descriptive statistics - Statistics, CSIR-NET Mathematical Sciences | Mathematics for IIT JAM, GATE, CSIR NET, UGC NET

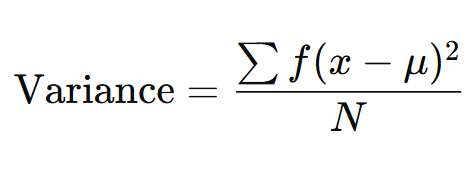
Variance: The average of the squared differences from the mean. 

Descriptive statistics - Statistics, CSIR-NET Mathematical Sciences | Mathematics for IIT JAM, GATE, CSIR NET, UGC NET

Standard Deviation: The square root of the variance. 

Descriptive statistics - Statistics, CSIR-NET Mathematical Sciences | Mathematics for IIT JAM, GATE, CSIR NET, UGC NET

3. Measures of Shape

Skewness: A measure of the asymmetry of the probability distribution of a real-valued random variable about its mean.

SkewnessKurtosis: A measure of the "tailedness" of the probability distribution. 

Descriptive statistics - Statistics, CSIR-NET Mathematical Sciences | Mathematics for IIT JAM, GATE, CSIR NET, UGC NET

High kurtosis means more of the variance is due to infrequent extreme deviations. 

4. Frequency Distribution:

Frequency: The number of times a data value occurs.

Relative Frequency: The fraction or proportion of times a value occurs.

Descriptive statistics - Statistics, CSIR-NET Mathematical Sciences | Mathematics for IIT JAM, GATE, CSIR NET, UGC NET

Cumulative Frequency: The sum of the frequencies for all data values less than or equal to a given value.

Question for Descriptive statistics - Statistics, CSIR-NET Mathematical Sciences
Try yourself:
What is the measure of central tendency that represents the middle value in a data set?
View Solution

Solved Example:

Question: In a class of 75 students, a statistics test is conducted for a maximum score of 25. The following table gives the frequencies against the test scores. Find the Mean, Median and Mode for the data.

 Test Score 

 1 

 5

6

8

10

12

13

14

15

17

20

21

24

 Number of
 Students

1

1

2

6

10

16

13

9

8

5

2

1

1

Solution: 
The Mean of a frequency distribution is calculated using the formula  Descriptive statistics - Statistics, CSIR-NET Mathematical Sciences | Mathematics for IIT JAM, GATE, CSIR NET, UGC NET   where N is the total number of observations.
We redo the table making suitable columns to enable the required calculations and include a cumulative frequency column (which is used to determine the median).

 Test Score
      x

 Frequency
        f

     fx    

Cumulative
Frequency

      1 

       1

        1

      1

      5

       1

        5

      2

      6

       2

      12

      4

      8

       6

      48

    10

    10

      10

     100

    20

    12

      16

     192

    36

    13

      13

     169

    49

    14

       9

     126

    58

    15

       8

     120

    66

    17

       5

      85

    71

    20

       2

      40

    73

    21

       1

      21

    74

    24

       1

      24

    75


 ∑f = 75

∑fx = 943 


The numbers in the cumulative frequency column against a test score gives the total count of frequencies for test scores equal and less.
Using the formula for mean
Descriptive statistics - Statistics, CSIR-NET Mathematical Sciences | Mathematics for IIT JAM, GATE, CSIR NET, UGC NET answer rounded to the tenth.
Hence the average test score = 12.6.
The median is given by the the middle value when the test scores are arranged as an ascending array.  That is Descriptive statistics - Statistics, CSIR-NET Mathematical Sciences | Mathematics for IIT JAM, GATE, CSIR NET, UGC NET test score is the median. The 38th item will be a test score 13, as 36 items have scores less than 13 and 49 items have scores less than 14.
Thus the median of the data set = 13.
The test score 12 has the greatest frequency = 16. Hence the mode of the data set is 12.


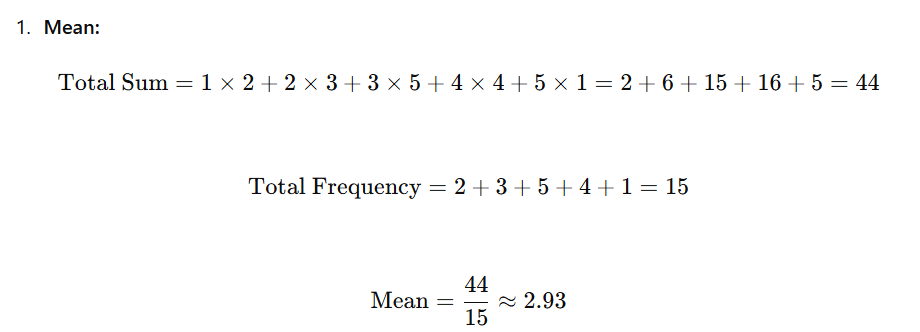
Question: Given a frequency distribution table, calculate the mean, variance, and standard deviation. 

Descriptive statistics - Statistics, CSIR-NET Mathematical Sciences | Mathematics for IIT JAM, GATE, CSIR NET, UGC NET

Solution: Descriptive statistics - Statistics, CSIR-NET Mathematical Sciences | Mathematics for IIT JAM, GATE, CSIR NET, UGC NET

2. Variance

μ=2.93
Descriptive statistics - Statistics, CSIR-NET Mathematical Sciences | Mathematics for IIT JAM, GATE, CSIR NET, UGC NET

Descriptive statistics - Statistics, CSIR-NET Mathematical Sciences | Mathematics for IIT JAM, GATE, CSIR NET, UGC NET

Descriptive statistics - Statistics, CSIR-NET Mathematical Sciences | Mathematics for IIT JAM, GATE, CSIR NET, UGC NETDescriptive statistics - Statistics, CSIR-NET Mathematical Sciences | Mathematics for IIT JAM, GATE, CSIR NET, UGC NET

Descriptive statistics - Statistics, CSIR-NET Mathematical Sciences | Mathematics for IIT JAM, GATE, CSIR NET, UGC NET

The document Descriptive statistics - Statistics, CSIR-NET Mathematical Sciences | Mathematics for IIT JAM, GATE, CSIR NET, UGC NET is a part of the Mathematics Course Mathematics for IIT JAM, GATE, CSIR NET, UGC NET.
All you need of Mathematics at this link: Mathematics
556 videos|198 docs

FAQs on Descriptive statistics - Statistics, CSIR-NET Mathematical Sciences - Mathematics for IIT JAM, GATE, CSIR NET, UGC NET

1. What are the different types of descriptive statistics?
Ans. Descriptive statistics include measures such as mean, median, mode, standard deviation, variance, range, and quartiles that summarize and describe the characteristics of a dataset.
2. How is the mean calculated in descriptive statistics?
Ans. The mean is calculated by summing up all the values in the dataset and then dividing by the total number of values. It is also known as the average value of the dataset.
3. What is the importance of descriptive statistics in mathematics?
Ans. Descriptive statistics help in summarizing and interpreting data in a meaningful way. They provide insights into the central tendency, dispersion, and shape of the data distribution, aiding in decision-making and analysis.
4. How is the range calculated in descriptive statistics?
Ans. The range is calculated by subtracting the minimum value from the maximum value in the dataset. It provides a measure of the spread or dispersion of the data.
5. Can descriptive statistics be used to make predictions about future data?
Ans. Descriptive statistics are primarily used to summarize and describe existing data, rather than make predictions about future data. For predictions, inferential statistics are more appropriate.
556 videos|198 docs
Download as PDF
Explore Courses for Mathematics exam
Signup for Free!
Signup to see your scores go up within 7 days! Learn & Practice with 1000+ FREE Notes, Videos & Tests.
10M+ students study on EduRev
Related Searches

Objective type Questions

,

CSIR-NET Mathematical Sciences | Mathematics for IIT JAM

,

Descriptive statistics - Statistics

,

pdf

,

Extra Questions

,

mock tests for examination

,

practice quizzes

,

Exam

,

GATE

,

CSIR-NET Mathematical Sciences | Mathematics for IIT JAM

,

MCQs

,

Previous Year Questions with Solutions

,

UGC NET

,

Sample Paper

,

GATE

,

Descriptive statistics - Statistics

,

shortcuts and tricks

,

CSIR NET

,

Summary

,

Free

,

UGC NET

,

UGC NET

,

past year papers

,

Viva Questions

,

Important questions

,

video lectures

,

CSIR NET

,

Descriptive statistics - Statistics

,

study material

,

CSIR-NET Mathematical Sciences | Mathematics for IIT JAM

,

ppt

,

GATE

,

Semester Notes

,

CSIR NET

;