Class 8 Exam  >  Class 8 Notes  >  Diagram

Diagram - Class 8 PDF Download

Draw a diagram to explain 3/4×2/3?
Ref: https://edurev.in/question/521845/Draw-a-diagram-to-explain-34×23-

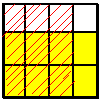
Now let's say we want to illustrate 3/4 of 2/3, (that means 3/4 x 2/3). We just take our square, and cut it into thirds and shade 2 of those thirds.

  2thirdssquare.gif (1297 bytes)

Now we cut the same square into FOURTHS using VERTICAL slices and we shade 3 of those fourths.
 3fourthsof 2thirdssquare.gif (2168 bytes)

Now to truly SEE the answer to 3/4 of 2/3 all you need do is look for the overlap. You see the yellow part is two thirds of the whole square, and we cut that yellow part into fourths and we shaded 3 of those fourths.  The red shaded yellow section consists of   6 rectangles out of the entire 12 rectangles in the square. 

In other words, multiplying across the numerators gives you the number of overlapped sections and multiplying across the denominators gives the total sections in the square.

The document Diagram - Class 8 is a part of Class 8 category.
All you need of Class 8 at this link: Class 8

Top Courses for Class 8

FAQs on Diagram - Class 8

1. What is a diagram?
A diagram is a visual representation of information or data, typically presented in a graphical format. It helps to convey complex concepts or relationships in a simplified and clear manner.
2. How can diagrams be useful in educational settings?
Diagrams are highly useful in educational settings as they aid in better understanding and retention of information. They can simplify complex concepts, facilitate visual learning, and enhance critical thinking skills.
3. What are some common types of diagrams used in various fields?
There are several types of diagrams used in different fields, such as flowcharts, Venn diagrams, mind maps, network diagrams, organizational charts, and Gantt charts. Each type serves a specific purpose and can be applied in various contexts.
4. What software or tools can be used to create diagrams?
There are numerous software and online tools available for creating diagrams. Some popular options include Microsoft Visio, Lucidchart, Google Drawings, Draw.io, and Creately. These tools offer a range of features and templates to design and customize diagrams.
5. How can diagrams be effectively incorporated in presentations or reports?
To effectively incorporate diagrams in presentations or reports, it is important to ensure they are clear, visually appealing, and relevant to the topic. Captions, labels, and colors can be used to enhance understanding. Additionally, it is crucial to explain the diagram's purpose and key points to the audience or readers.
Download as PDF
Explore Courses for Class 8 exam

Top Courses for Class 8

Signup for Free!
Signup to see your scores go up within 7 days! Learn & Practice with 1000+ FREE Notes, Videos & Tests.
10M+ students study on EduRev
Related Searches

pdf

,

Important questions

,

shortcuts and tricks

,

Semester Notes

,

study material

,

Sample Paper

,

mock tests for examination

,

Exam

,

Diagram - Class 8

,

MCQs

,

Previous Year Questions with Solutions

,

Viva Questions

,

Free

,

Objective type Questions

,

video lectures

,

practice quizzes

,

Diagram - Class 8

,

past year papers

,

Summary

,

Extra Questions

,

ppt

,

Diagram - Class 8

;