Diagrammatic Derivation of Saving Curve from Consumption Curve - Commerce PDF Download
Draw consumption curve and saving curve in a single diagram and mark the break even point ?
Ref: https://edurev.in/question/746766/Draw-consumption-curve-and-saving-curve-in-a-single-diagram-and-mark-the-break-even-point-
Diagrammatic Derivation of Saving Curve from Consumption Curve!
We know that consumption + saving is always equal to Income because income is either consumed or saved.
It implies that consumption and saving curves representing consumption and saving functions are complementary curves.
Therefore, we can derive saving function or curve directly from consumption function or curve. This has been depicted in the adjoining Fig. 8.7 comprising Part-A showing consumption function and Part-B showing saving function.
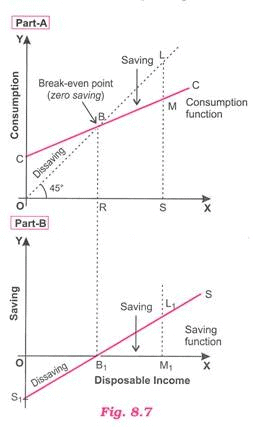
In Part-A of this Figure, CC curve shows consumption function corresponding to each level of income whereas 45° line represents income. Recall that each point on 45° line is equidistant from X-axis and Y-axis. C curve intersects 45° line at point B at which BR = OR, i.e., consumption = Income. Therefore, point B is called Break-even point showing zero saving.
It emphasises that saving curve must intersect x-axis at the same income level where consumption curve and 45° line intersect. Further, it will be seen that to the left of point B, consumption function lies above 45° line showing that consumption is more than income, i.e., negative saving and to the right of point B, consumption function lies below 45° line showing positive saving.
Now, in Part-B we derive saving function in the form of saving curve. Remember, in Part-A, the amount of saving (or dissaving) is the vertical distance between C curve and 45° line. By plotting in Part-B of the Fig. 8.7, the vertical distances of Part-A representing saving/dissaving and by joining them, we derive a saving curve. For instance, at 0 (zero) level of income in Part-A, vertical distance OC (representing dissaving) is plotted as OS1 below X-axis in Part-B.
Similarly, at OR level of income in Part-A, vertical distance at point B being nil is shown as point B1 on X-axis in lower part of the Fig. Likewise, LM vertical distance of Part-A is shown as L1M1 in Part-B. By joining points S, B1 and L1 in lower segment, we get saving curve. Thus, saving curve/function is diagrammatically derived from consumption curve/function.
FAQs on Diagrammatic Derivation of Saving Curve from Consumption Curve - Commerce
| 1. How is the saving curve derived from the consumption curve? |  |
| 2. What does the saving curve represent in the context of the article? | |
| 3. How can the saving curve be useful in understanding an economy? | |
| 4. Can the saving curve and consumption curve intersect? | |
| 5. How can changes in the saving curve affect the economy? | |

|
1.9K Views |

|
4.91/5 Rating |

|
Nov 24, 2024 Last updated |

|
Explore Courses for Commerce exam
|
|
mock tests for examination
,Viva Questions
,Previous Year Questions with Solutions
,study material
,Objective type Questions
,video lectures
,Semester Notes
,Free
,ppt
,Diagrammatic Derivation of Saving Curve from Consumption Curve - Commerce
,Extra Questions
,Exam
,past year papers
,Diagrammatic Derivation of Saving Curve from Consumption Curve - Commerce
,practice quizzes
,shortcuts and tricks
,Summary
,Sample Paper
,Diagrammatic Derivation of Saving Curve from Consumption Curve - Commerce
,MCQs
,Important questions
;


Diagrammatic Derivation of Saving Curve from Consumption Curve - Commerce Free PDF Download
Importance of Diagrammatic Derivation of Saving Curve from Consumption Curve - Commerce
Diagrammatic Derivation of Saving Curve from Consumption Curve - Commerce Notes
Diagrammatic Derivation of Saving Curve from Consumption Curve - Commerce Commerce Questions
Study Diagrammatic Derivation of Saving Curve from Consumption Curve - Commerce on the App
|
© EduRev
|
Education Revolution
|


Follow Us
|


