ER Diagram | Database Management System (DBMS) - Computer Science Engineering (CSE) PDF Download
Minimization of ER Diagrams
Entity-Relationship (ER) Diagram is a diagrammatic representation of data in databases, it shows how data is related.
Note: This article for those who already know what is ER diagram and how to draw ER diagram.
1. When there are One to Many cardinalities in the ER diagram.
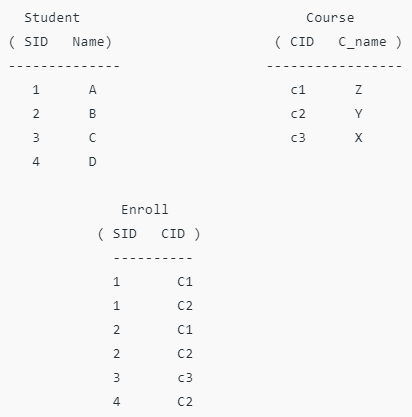
For example, a student can be enrolled only in one course, but a course can be enrolled by many students
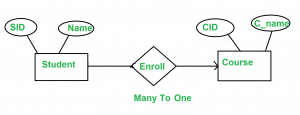
For Student(SID, Name), SID is the primary key. For Course ( CID, C_name ), CID is the primary key
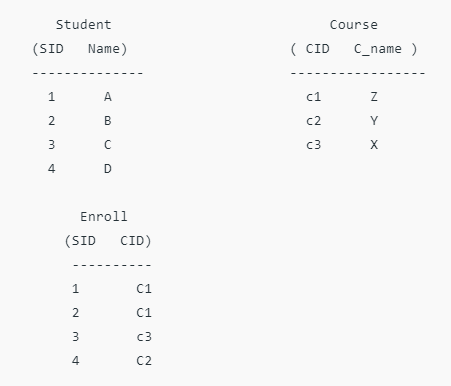
Now the question is, what should be the primary key for Enroll SID or CID or combined. We can’t have CID as the primary key as you can see in enroll for the same CID we have multiples SID. (SID, CID) can distinguish table uniquely, but it is not minimum. So SID is the primary key for the relation enrollment.
For the above ER diagram, we considered three tables in the database

But we can combine Student and Enroll table renamed as Student_enroll.
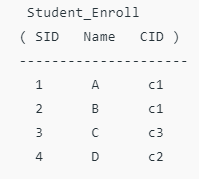
Student and enroll tables are merged now.
So require a minimum of two DBMS tables for Student_enroll and Course.
Note: In One to Many relationships we can have a minimum of two tables.
2. When there are Many to Many cardinalities in ER Diagram.
Let us consider the above example with the change that now a student can also enroll in more than 1 course.
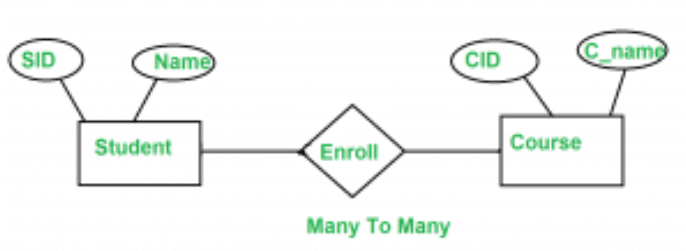
Now, the same question what is the primary key of Enroll relation, if we carefully analyze the Enroll primary key for Enroll the table is ( SID, CID ).
But in this case, we can’t merge Enroll table with any one of the Student and Course. If we try to merge Enroll with any one of the Student and Course it will create redundant data.
Note: Minimum of three tables are required in the Many to Many relationships.
3. One to One Relationship
There are two possibilities
(i) If we have One to One relationship and we have total participation at at-least one end.
For example, consider the below ER diagram.
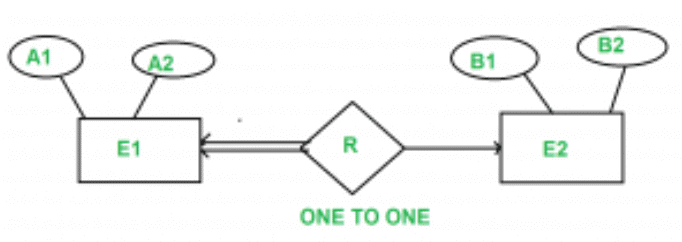
A1 and B1 are primary keys of E1 and E2 respectively.
In the above diagram, we have total participation at the E1 end.
Only a single table is required in this case having the primary key of E1 as its primary key.
Since E1 is in total participation, each entry in E1 is related to only one entry in E2, but not all entries in E2 are related to an entry in E1.
The primary key of E1 should be allowed as the primary key of the reduced table since if the primary key of E2 is used, it might have null values for many of its entries in the reduced table.
Note: Only 1 table required.
(ii) One to One relationship with no total participation.
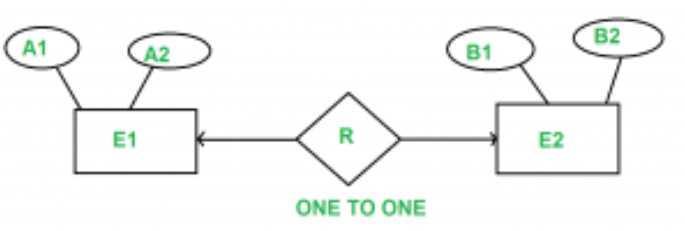
A1 and B1 are primary keys of E1 and E2 respectively.
The primary key of R can be A1 or B1, but we can’t still combine all three tables into one. if we do, so some entries in the combined table may have NULL entries. So the idea of merging all three tables into one is not good.
But we can merge R into E1 or E2. So a minimum of 2 tables is required.
Enhanced ER Model
Today time the complexity of the data is increasing so it becomes more and more difficult to use the traditional ER model for database modeling. To reduce this complexity of modeling we have to make improvements or enhancements were made to the existing ER model to make it able to handle the complex application in a better way.
Enhanced entity-relationship diagrams are advanced database diagrams very similar to regular ER diagrams which represent requirements and complexities of complex databases.
It is a diagrammatic technique for displaying the Sub Class and Super Class; Specialization and Generalization; Union or Category; Aggregation etc.
Generalization and Specialization
These are very common relationships found in real entities. However, this kind of relationship was added later as an enhanced extension to the classical ER model. Specialized classes are often called subclass while a generalized class is called a superclass, probably inspired by object-oriented programming. A sub-class is best understood by “IS-A analysis”. Following statements hopefully makes some sense to your mind “Technician IS-A Employee”, “Laptop IS-A Computer”.
An entity is a specialized type/class of another entity. For example, a Technician is a special Employee in a university system Faculty is a special class of Employee. We call this phenomenon generalization/specialization. In the example here Employee is a generalized entity class while the Technician and Faculty are specialized classes of Employee.
Example: This example instance of “sub-class” relationships. Here we have four sets of employees: Secretary, Technician, and Engineer. The employee is super-class of the rest three sets of individual sub-class is a subset of Employee set.
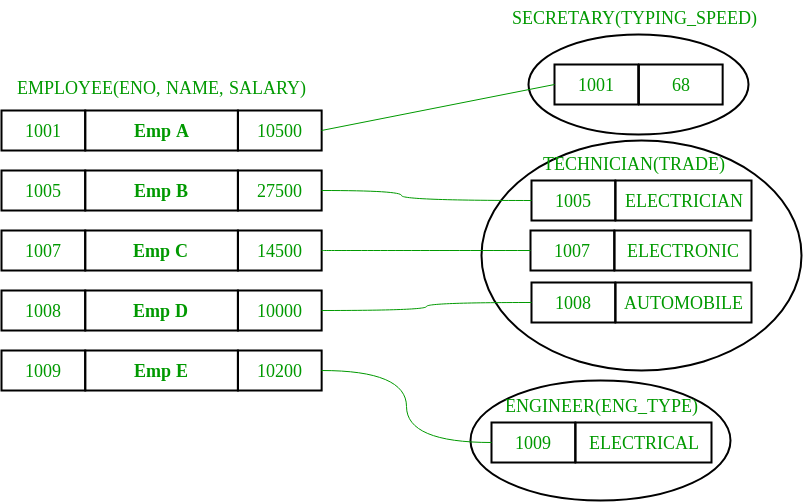
- An entity belonging to a sub-class is related to some super-class entity. For instance emp, no 1001 is a secretary, and his typing speed is 68. Emp no 1009 is an engineer (sub-class) and her trade is “Electrical”, so forth.
- Sub-class entity “inherits” all attributes of super-class; for example, employee 1001 will have attributes eno, name, salary, and typing speed.
Enhanced ER model of above example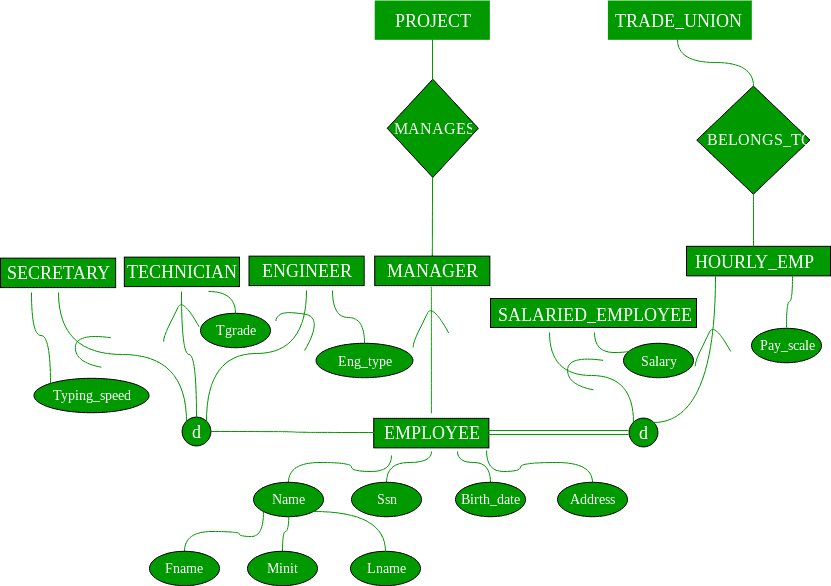
Constraints: There are two types of constraints on the “Sub-class” relationship.
- Total or Partial: A sub-classing relationship is total if every super-class entity is to be associated with some sub-class entity, otherwise partial. Sub-class “job type based employee category” is partial sub-classing – not necessary every employee is one of (secretary, engineer, and technician), i.e. union of these three types is a proper subset of all employees. Whereas other sub-classing “Salaried Employee AND Hourly Employee” is total; the union of entities from sub-classes is equal to the total employee set, i.e. every employee necessarily has to be one of them.
- Overlapped or Disjoint: If an entity from super-set can be related (can occur) in multiple sub-class sets, then it is overlapped sub-classing, otherwise disjoint. Both the examples: job-type based and salaries/hourly employee sub-classing are disjoint.
Note: These constraints are independent of each other: can be “overlapped and total or partial” or “disjoint and total or partial”. Also, sub-classing has transitive property.
Multiple Inheritance (sub-class of multiple superclasses)
An entity can be a sub-class of multiple entity types; such entities are sub-class of multiple entities and have multiple super-classes; Teaching Assistant can subclass of Employee and Student both. A faculty in a university system can be a subclass of Employee and Alumnus. In multiple inheritances, attributes of sub-class are the union of attributes of all super-classes.
Union
Set of Libray Members is UNION of Faculty, Student, and Staff. A union relationship indicates either type; for example, a library member is either Faculty or Staff or Student.
Below are two examples show how UNION can be depicted in ERD – Vehicle Owner is UNION of PERSON and Company, and RTO Registered Vehicle is UNION of Car and Truck.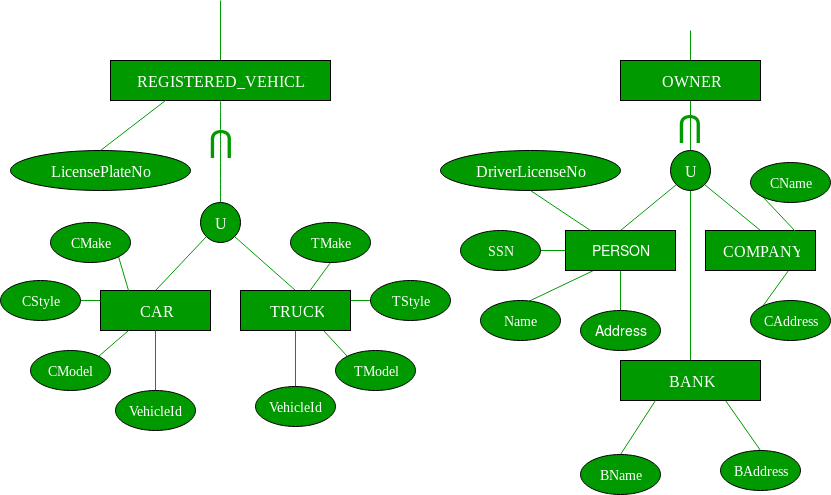
You might see some confusion in Sub-class and UNION; consider an example in above figure Vehicle is super-class of CAR and Truck; this is very much the correct example of the subclass as well but here use it differently we are saying RTO Registered vehicle is UNION of Car and Vehicle, they do not inherit any attribute of Vehicle, attributes of car and truck are altogether independent set, where is in sub-classing situation car and truck would be inheriting the attribute of vehicle class.
Mapping from ER Model to Relational Model
After designing the ER diagram of system, we need to convert it to Relational models which can directly be implemented by any RDBMS like Oracle, MySQL etc. In this article we will discuss how to convert ER diagram to Relational Model for different scenarios.
Case 1: Binary Relationship with 1 : 1 cardinality with total participation of an entity
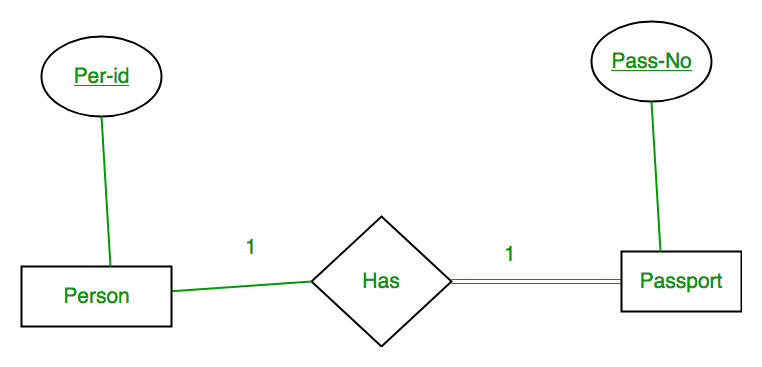
A person has 0 or 1 passport number and Passport is always owned by 1 person. So it is 1 : 1 cardinality with full participation constraint from Passport.
First Convert each entity and relationship to tables: Person table corresponds to Person Entity with key as Per-Id. Similarly Passport table corresponds to Passport Entity with key as Pass-No. Has Table represents relationship between Person and Passport (Which person has which passport). So it will take attribute Per-Id from Person and Pass-No from Passport.
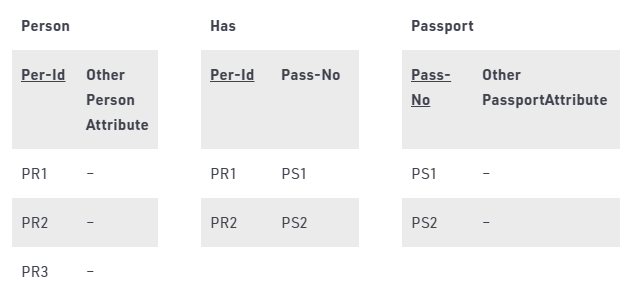 Table 1
As we can see from Table 1, each Per-Id and Pass-No has only one entry in Has table. So we can merge all three tables into 1 with attributes shown in Table 2. Each Per-Id will be unique and not null. So it will be the key. Pass-No can’t be key because for some person, it can be NULL.
 Table 2
Case 2: Binary Relationship with 1 : 1 cardinality and partial participation of both entities
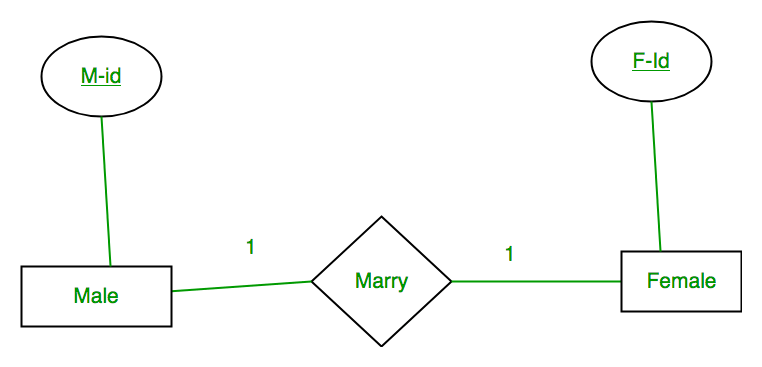
A male marries 0 or 1 female and vice versa as well. So it is 1:1 cardinality with partial participation constraint from both. First Convert each entity and relationship to tables. Male table corresponds to Male Entity with key as M-Id. Similarly Female table corresponds to Female Entity with key as F-Id. Marry Table represents relationship between Male and Female (Which Male marries which female). So it will take attribute M-Id from Male and F-Id from Female.
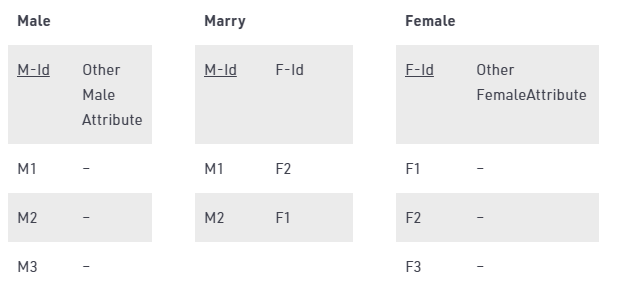 Table 3
As we can see from Table 3, some males and some females do not marry. If we merge 3 tables into 1, for some M-Id, F-Id will be NULL. So there is no attribute which is always not NULL. So we can’t merge all three tables into 1. We can convert into 2 tables. In table 4, M-Id who are married will have F-Id associated. For others, it will be NULL. Table 5 will have information of all females. Primary Keys have been underlined.
 Table 4
 Table 5
Note: Binary relationship with 1 : 1 cardinality will have 2 table if partial participation of both entities in the relationship. If at least 1 entity has total participation, number of tables required will be 1.
Case 3: Binary Relationship with n : 1 cardinality
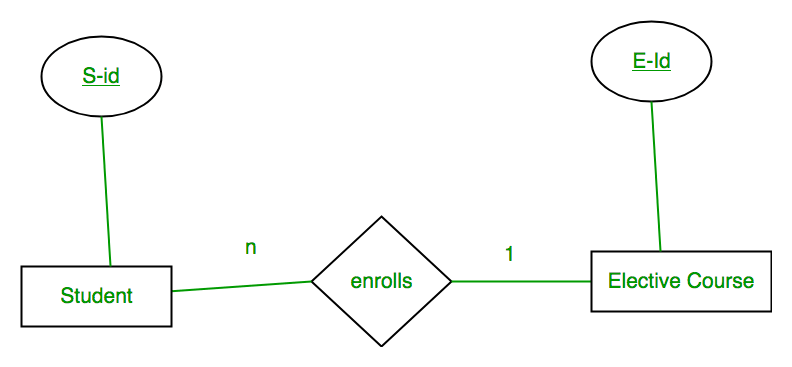
In this scenario, every student can enroll only in one elective course but for an elective course there can be more than one student. First Convert each entity and relationship to tables. Student table corresponds to Student Entity with key as S-Id. Similarly Elective_Course table corresponds to Elective_Course Entity with key as E-Id. Enrolls Table represents relationship between Student and Elective_Course (Which student enrolls in which course). So it will take attribute S-Id from and Student E-Id from Elective_Course.
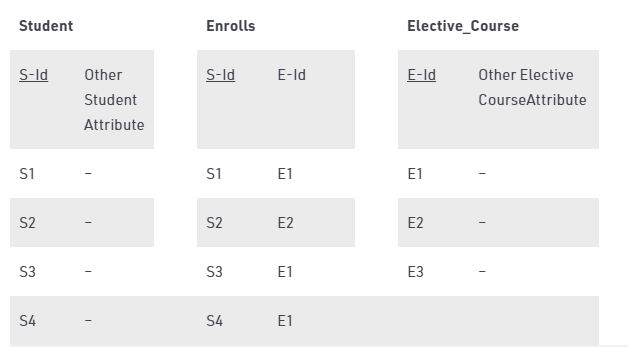 Table 6
As we can see from Table 6, S-Id is not repeating in Enrolls Table. So it can be considered as a key of Enrolls table. Both Student and Enrolls Table’s key is same; we can merge it as a single table. The resultant tables are shown in Table 7 and Table 8. Primary Keys have been underlined.
 Table 7
 Table 8
Case 4: Binary Relationship with m : n cardinality
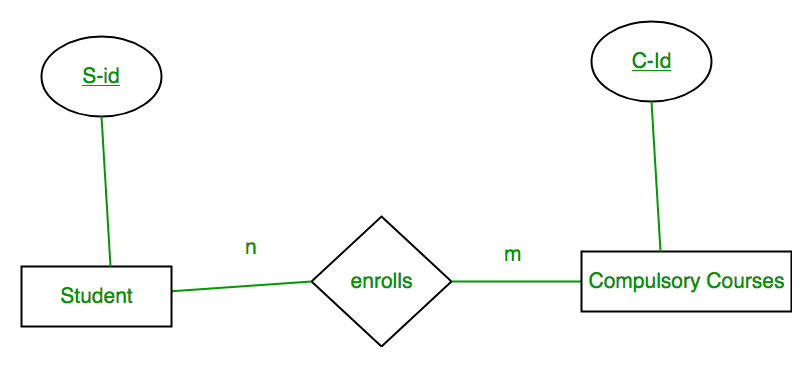
In this scenario, every student can enroll in more than 1 compulsory course and for a compulsory course there can be more than 1 student. First Convert each entity and relationship to tables. Student table corresponds to Student Entity with key as S-Id. Similarly Compulsory_Courses table corresponds to Compulsory Courses Entity with key as C-Id. Enrolls Table represents relationship between Student and Compulsory_Courses (Which student enrolls in which course). So it will take attribute S-Id from Person and C-Id from Compulsory_Courses.
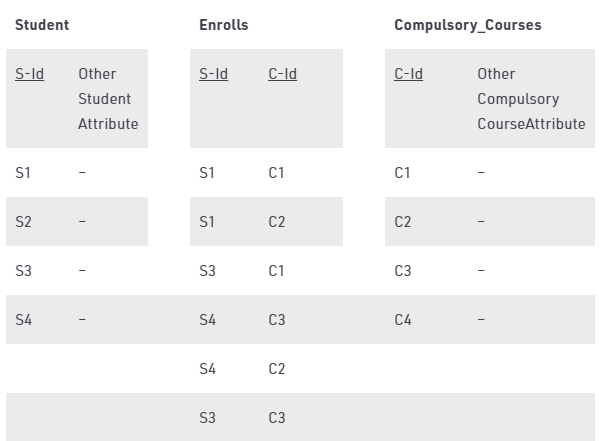 Table 9
As we can see from Table 9, S-Id and C-Id both are repeating in Enrolls Table. But its combination is unique; so it can be considered as a key of Enrolls table. All tables’ keys are different, these can’t be merged. Primary Keys of all tables have been underlined.
Case 5: Binary Relationship with weak entity
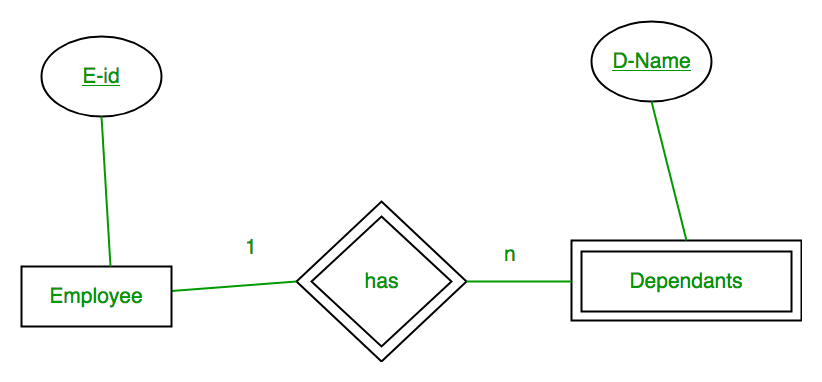
In this scenario, an employee can have many dependants and one dependant can depend on one employee. A dependant does not have any existence without an employee (e.g; you as a child can be dependant of your father in his company). So it will be a weak entity and its participation will always be total. Weak Entity does not have key of its own. So its key will be combination of key of its identifying entity (E-Id of Employee in this case) and its partial key (D-Name).
First Convert each entity and relationship to tables. Employee table corresponds to Employee Entity with key as E-Id. Similarly Dependants table corresponds to Dependant Entity with key as D-Name and E-Id. Has Table represents relationship between Employee and Dependants (Which employee has which dependants). So it will take attribute E-Id from Employee and D-Name from Dependants.
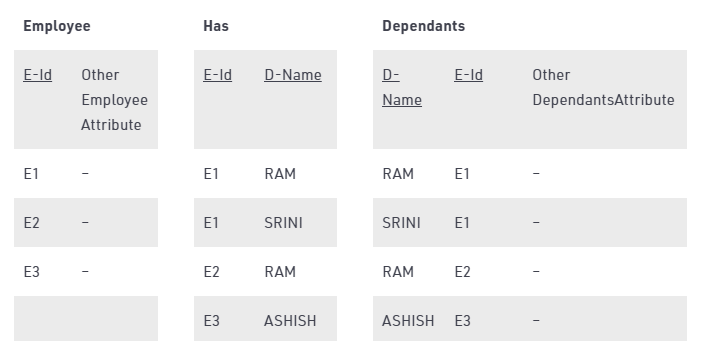 Table 10
As we can see from Table 10, E-Id, D-Name is key for Has as well as Dependants Table. So we can merge these two into 1. So the resultant tables are shown in Tables 11 and 12. Primary Keys of all tables have been underlined.
 Table 11
 Table 12
|
62 videos|67 docs|35 tests
|
FAQs on ER Diagram - Database Management System (DBMS) - Computer Science Engineering (CSE)
| 1. What is an ER diagram and why is it important in the field of database management? |  |
| 2. How can ER diagrams be used to minimize the complexity of database systems? |  |
| 3. What are some common challenges faced in minimizing ER diagrams? |  |
| 4. How does the minimization of ER diagrams impact database performance? |  |
| 5. Are there any tools or software available to assist in the minimization of ER diagrams? |  |


