NCERT Solutions for Class 10 Maths Chapter 13 - Statistics (Exercise 13.3)
Q1: The following frequency distribution gives the monthly consumption of electricity of 68 consumers of a locality. Find the median, mean and mode of the data and compare them.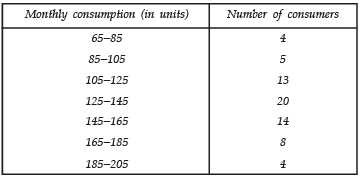
Sol:
Median
Let us prepare a cumulative frequency table: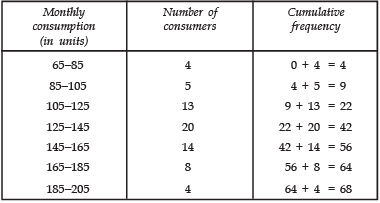
Now, we have 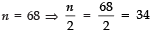
∵ This observation lies in the class 125−145.
∴ 125−145 is the median class.
∴ l = 125, cf = 22
f = 20 and h = 20
Using the formula,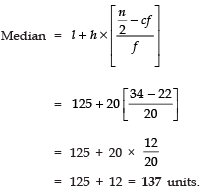
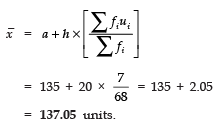
Mean Assumed mean (a) = 135
∵ Class interval (h) = 20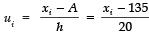
Now, we have the following table: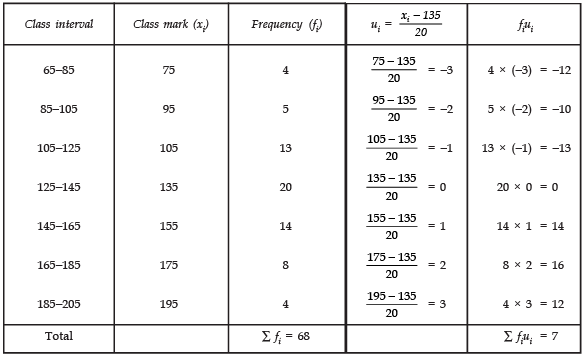
Mode
∵ Class 125−145 has the highest frequency.
∴ This is the modal class.
We have:
h = 20
l = 125
f1 = 20
f0 = 13
f2 = 14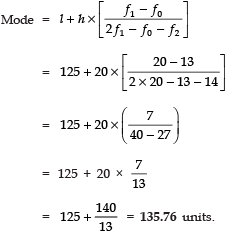
We observe that the three measures are approximately equal in this case.
Q2: If the median of the distribution given below is 28.5, find the values of x and y.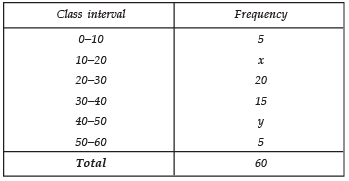
Sol: Here, we have n = 60 [∵ ∑fi = 60]
Now, cumulative frequency table is: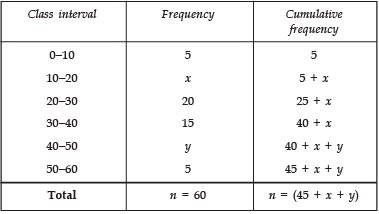
Since, median = 28.5
∴ Median class is 20 − 30
We have: l = 20
h = 10
f = 20
cf = 5 + x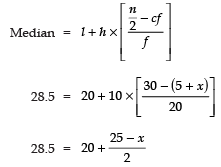
⇒ 57 = 40 + 25 − x
⇒ x = 40 + 25 − 57 = 8
Also 45 + x + y = 60
⇒ 45 + 8 + y = 60
⇒ y = 60 − 45 − 8 = 7
Thus, x = 8
y = 7
Q3: A life insurance agent found the following data for distribution of ages of 100 policy holders. Calculate the median age, if policies are given only to persons having age 18 years on wards but less than 60 years.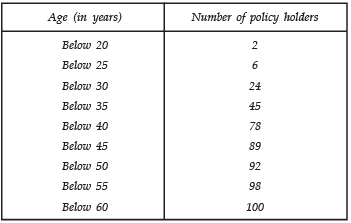
Sol: The given table is cumulative frequency distribution. We write the frequency distribution as given below: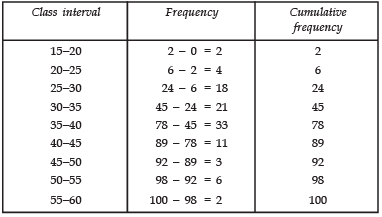
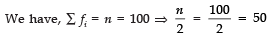
∵ The cumulative frequency just greater than n/2 i.e., just greater than 50 is 78.
∴ The median class is 78.
Now n/2 = 50, l = 35, cf = 45, f = 33 and h = 5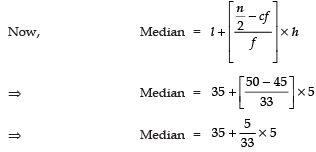
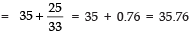
Thus, the median age = 35.76 years.
Q4: The lengths of 40 leaves of a plant are measured correct to the nearest millimetre, and the data obtained is represented in the following table: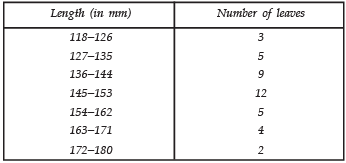
Find the median length of the leaves.
[Hint: The data needs to be converted to continuous classes for finding the median, since the formula assumes continuous classes. The classes then change to 117.5−126.5, 126.5−135.5, ..., 171.5−180.5]
Sol: After changing the given table as continuous classes we prepare the cumulative frequency table: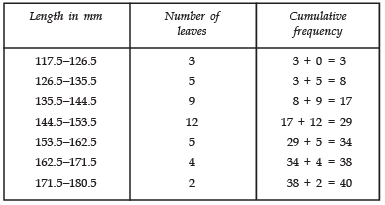
∑ fi =40 ⇒ n = 40
Now,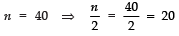
The cumulative frequency just above n/2 i.e., 20 is 29 and it corresponds to the class 144.5−153.5.
So, 144.5−153.5 is the median class.
We have:
n/2 = 20, l = 144.5, f = 12, cf = 17 and h = 9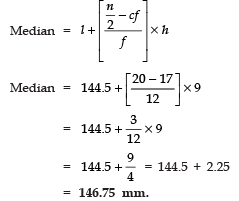
Q5: The following table gives the distribution of the life time of 400 neon lamps: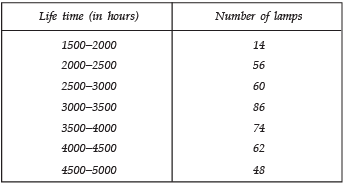
Find the median life time of a lamp
Sol: To compute the median, let us write the cumulative frequency distribution as given below: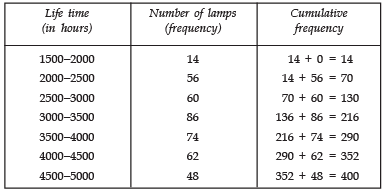
∑ fi = 400 ⇒ n = 400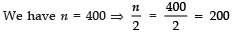
Since, the cumulative frequency just greater than n/2 i.e., greater than 200 is 216.
∴ The median class is 3000−3500
∴ l = 3000, cf = 130, f = 86, h = 500 and n/2 = 200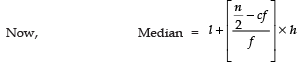
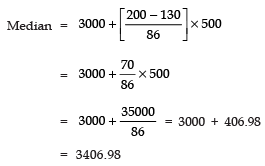
Thus, median life = 3406.98 hours.
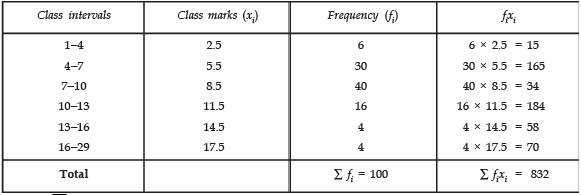
Q6: 100 surnames were randomly picked up from a local telephone directory and the frequency distribution of the number of letters in the English alphabets in the surnames was obtained as follows: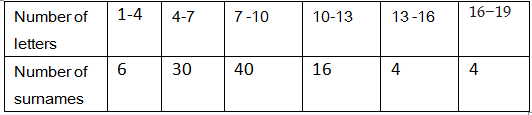
Determine the median number of letters in the surnames. Find the mean number of letters in the surnames? Also, find the modal size of the surnames.
Sol: Median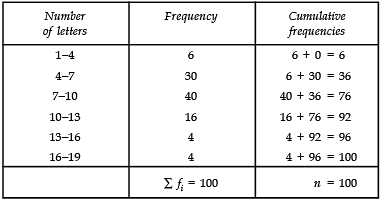
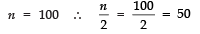
Since, the cumulative frequency just greater than n/2 i.e., greater than 50 is 76.
∴ The class 7 − 10 is the median class,
We have 
l = 7
cf = 36
f = 40 and h = 3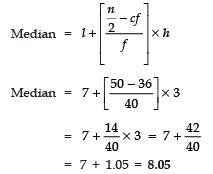
Mode
Since the class 7−10 has the maximum frequency.
∴ The modal class is 7−10
So, we have
l = 7, h = 3
f1 = 40,
f0 = 30
f2 = 16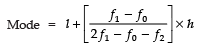
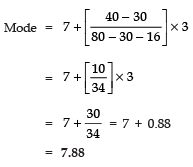
Thus, the required Median = 8.05,
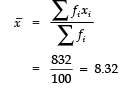
Mean = 8.32 and Mode = 7.88.
Q7: The distribution below gives the weights of 30 students of a class. Find the median weight of the students.
Sol: We have
Weight (in kg) | Frequency (f) | Cumulative frequency |
40-45 | 2 | 2 + 0= 2 |
45-50 | 3 | 2 + 3= 5 |
50-55 | 8 | 5 + 8 = 13 |
55-60 | 6 | 13 + 6 = 19 |
60-65 | 6 | 19 + 6 = 25 |
65-70 | 3 | 25 + 3 = 28 |
70-75 | 2 | 28 + 2 = 30 |
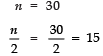
Total | If = 30 | n = 30 |
The cumulative frequency just more than n/2 i.e., more than 15 is 19, which corresponds to the class 55−60.
n/2 = 15.
l = 5
5f = 6
cf = 13 and h = 5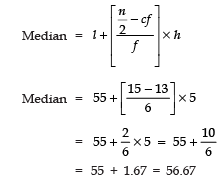
Thus, the required median weight = 56.67 kg.
|
5 videos|378 docs|164 tests
|
FAQs on NCERT Solutions for Class 10 Maths Chapter 13 - Statistics (Exercise 13.3)
| 1. What is the importance of statistics in our daily lives? |  |
| 2. How is statistics used in business and economics? | |
| 3. What are the different types of statistical measures? | |
| 4. How does statistics help in scientific research? | |
| 5. Can statistics be used to make predictions about the future? | |

|
5K Views |

|
4.70/5 Rating |

|
Dec 26, 2024 Last updated |

|
Explore Courses for CAT exam
|
|
practice quizzes
,Previous Year Questions with Solutions
,Sample Paper
,Exam
,Viva Questions
,Important questions
,NCERT Solutions for Class 10 Maths Chapter 13 - Statistics (Exercise 13.3)
,study material
,Extra Questions
,shortcuts and tricks
,ppt
,MCQs
,NCERT Solutions for Class 10 Maths Chapter 13 - Statistics (Exercise 13.3)
,video lectures
,NCERT Solutions for Class 10 Maths Chapter 13 - Statistics (Exercise 13.3)
,Semester Notes
,Objective type Questions
,mock tests for examination
,Summary
,Free
,past year papers
;


NCERT Solutions: Statistics (Exercise 13.3) Free PDF Download
Importance of NCERT Solutions: Statistics (Exercise 13.3)
NCERT Solutions: Statistics (Exercise 13.3) Notes
NCERT Solutions: Statistics (Exercise 13.3) CAT Questions
Study NCERT Solutions: Statistics (Exercise 13.3) on the App
|
© EduRev
|
Education Revolution
|


|


