CAT Exam  >  CAT Notes  >  Additional Study Material for CAT  >  NCERT Solutions: Statistics (Exercise 14.4)

NCERT Solutions for Class 10 Maths Chapter 13 - Statistics (Exercise 14.4)

NCERT TEXTBOOK QUESTIONS SOLVED
Page No. 293
EXERCISE 14.4
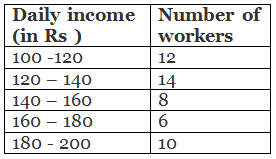
Q 1. The following distribution gives the daily income of 50 workers of a factory 
NCERT Solutions for Class 10 Maths Chapter 13 - Statistics (Exercise 14.4)

Convert the distribution above to a less than type cumulative frequency distribution, and draw its ogive.
Sol. We have the cumulative frequency distribution as:

Daily income (in Rs )

Cumulative frequencies

Less than 120

12 + 0 = 12

Less than 140

12 + 14 = 26

Less than 160

26 + 8 = 34

Less than 180

34 + 6 = 40

Less than 200

40 + 10 = 50

Now, we plot the points corresponding to the ordered pairs (120, 12), (140, 26), (160, 34), (180, 40) and (200, 50) on a graph paper and join them by a free hand smooth curve as shown below:
NCERT Solutions for Class 10 Maths Chapter 13 - Statistics (Exercise 14.4)
The curve so obtained is called the less than o give.

Q 2. During the medical check-up of 35 students of a class, their weights were recorded as follows:

Weight (in kg)

Number of students

Less than 38

0

Less than 40

3

Less than 42

5

Less than 44

9

Less than 46

14

Less than 48

28

Less than 50

32

Less than 52

35

Draw a less than type ogive for the given data. Hence obtain the median weight from the graph and verify the result by using the formula
Sol. Here, the values 38, 40, 42, 44, 46, 48, 50 and 52 are the upper limits of the respective class intervals.
We plot the points (ordered pairs) (38, 0), (40, 3), (42, 5), (44, 9), (46, 14), (48, 28), (50, 32) and (52, 35) on a graph paper and join them by a free hand smooth curve.
The curve so obtained is the less than type ogive.
∵ n = 35
NCERT Solutions for Class 10 Maths Chapter 13 - Statistics (Exercise 14.4)
The point 17.5 is on y-axis.
NCERT Solutions for Class 10 Maths Chapter 13 - Statistics (Exercise 14.4)
From this point (i.e., from 17.5) we draw a line parallel to the x-axis which cuts the curve at P. From this point (i.e., from P), draw a perpendicular to the x-axis, meeting the x-axis at Q. The point Q represents the median of the data which is 47.5.
Verification
To verify the result using the formula, let us make the following table in order to find median using the formula:

Weight (in kg)

Number of students [Cumulative frequency]

0-38

0

38-40

3

40-42

5

42-44

9

44-46

14

46-48

28

48-50

32

50-52

35

Here,
NCERT Solutions for Class 10 Maths Chapter 13 - Statistics (Exercise 14.4)
Since, this observation lies in the class 46 − 48.
∴ The median class is 46 − 48 such that l = 46, h = 2, f = 14, cf = 14
NCERT Solutions for Class 10 Maths Chapter 13 - Statistics (Exercise 14.4)
Thus, the median = 46.5 kg is approximately verified.

Q 3. The following table gives production yield per hectare of wheat of 100 farms of a village.

Production yield (in kg/ha)

50-55

55-60

60-65

65-70

70-75

75-80

Number of farms

2

8

12

24

38

16

Change the distribution to a more than type distribution, and draw its ogive.
Sol. For ‘more than type’ distribution, we have:

Production yield (in kg/ha)

Number of farms (Cumulative frequencies)

More than 50

100

More than 55

98

More than 60

90

More than 65

78

More than 70

54

More than 75

16

Now, we plot the points (50, 100), (55, 98), (60, 90), (65, 78), (70, 54) and (75, 16) and join the points with a free hand curve.
NCERT Solutions for Class 10 Maths Chapter 13 - Statistics (Exercise 14.4)
The curve so obtained is the ‘more than type ogive’.

The document NCERT Solutions for Class 10 Maths Chapter 13 - Statistics (Exercise 14.4) is a part of the CAT Course Additional Study Material for CAT.
All you need of CAT at this link: CAT
5 videos|378 docs|164 tests

Top Courses for CAT

FAQs on NCERT Solutions for Class 10 Maths Chapter 13 - Statistics (Exercise 14.4)

1. What is the importance of statistics in everyday life?
Ans. Statistics plays a crucial role in everyday life as it helps in making informed decisions based on data analysis. It helps in understanding trends, patterns, and variability in various fields such as business, economics, healthcare, and social sciences. For example, statistics can be used to analyze market trends, evaluate the effectiveness of a medical treatment, or determine the impact of a social program.
2. How is statistics used in research studies?
Ans. Statistics is an essential tool in research studies as it helps in collecting, organizing, and analyzing data. Researchers use statistical techniques to summarize and interpret their findings, identify relationships between variables, and draw meaningful conclusions. It enables researchers to make reliable inferences about a population based on a sample, ensuring the validity and generalizability of their results.
3. What are the different types of data in statistics?
Ans. In statistics, data can be classified into two main types: numerical and categorical data. Numerical data consists of numbers and can be further divided into discrete data (countable, finite values) and continuous data (measurable, infinite values). Categorical data, on the other hand, represents characteristics or qualities and can be divided into nominal data (categories with no specific order) and ordinal data (categories with a specific order).
4. How can statistics be used to interpret survey results?
Ans. Statistics is used to interpret survey results by analyzing the collected data. This involves calculating measures of central tendency (such as mean, median, and mode) to determine the average response or opinion. Additionally, measures of dispersion (such as range or standard deviation) are used to assess the variability or spread of the survey results. Statistical techniques like hypothesis testing can also be employed to determine the significance of observed differences or relationships within the survey data.
5. What are the limitations of statistics?
Ans. While statistics is a powerful tool, it has certain limitations. One limitation is that statistics cannot prove causation, only correlation. In other words, statistical analysis can show a relationship between variables, but it cannot establish a cause-and-effect relationship. Additionally, statistics are dependent on the quality of the data collected, and if the data is biased or inaccurate, it can lead to erroneous conclusions. It is also important to consider the assumptions and limitations of statistical models and techniques used, as they may not always be applicable to every situation.
5 videos|378 docs|164 tests
Download as PDF
Explore Courses for CAT exam

Top Courses for CAT

Signup for Free!
Signup to see your scores go up within 7 days! Learn & Practice with 1000+ FREE Notes, Videos & Tests.
10M+ students study on EduRev
Related Searches

video lectures

,

Semester Notes

,

MCQs

,

Important questions

,

Free

,

Objective type Questions

,

NCERT Solutions for Class 10 Maths Chapter 13 - Statistics (Exercise 14.4)

,

pdf

,

shortcuts and tricks

,

mock tests for examination

,

study material

,

Summary

,

practice quizzes

,

Exam

,

NCERT Solutions for Class 10 Maths Chapter 13 - Statistics (Exercise 14.4)

,

Viva Questions

,

ppt

,

Previous Year Questions with Solutions

,

past year papers

,

Sample Paper

,

Extra Questions

,

NCERT Solutions for Class 10 Maths Chapter 13 - Statistics (Exercise 14.4)

;