NCERT Solutions for Class 9 Maths Chapter 14 - Exercise 14.4 Statistics
Question 1. The following number of goals were scored by a team in a series of 10 matches:
2, 3, 4, 5, 0, 1, 3, 3, 4, 3
Find the mean, median and mode of these scores.
Solution:
Mean = Average = Sum of all the observations/Total number of observations
= (2+3+4+5+0+1+3+3+4+3)/10
= 28/10
= 2.8
Median,
To find the median, we first arrange the data in ascending order.
0, 1, 2, 3, 3, 3, 3, 4, 4, 5
Here,
Number of observations (n) = 10
Since the number of observations are even, the median can be calculated as: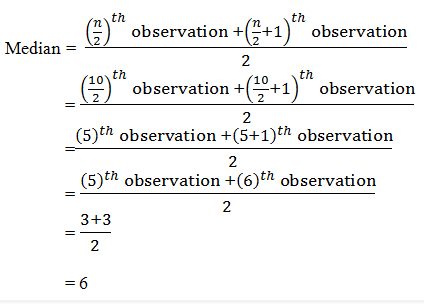
= 3
Mode,
To find the mode, we first arrange the data in ascending order.
0, 1, 2, 3, 3, 3, 3, 4, 4, 5.
Here,
We find that 3 occurs most frequently (4 times)
∴ Mode = 3
Question 2. In a mathematics test given to 15 students, the following marks (out of 100) are recorded:
41, 39, 48, 52, 46, 62, 54, 40, 96, 52, 98, 40, 42, 52, 60
Find the mean, median and mode of this data.
Solution:
Mean=Average = Sum of all the observations/Total number of observations
= (41+39+48+52+46+62+54+40+96+52+98+40+42+52+60)/15
= 822/15
= 54.8
Median,
To find the median, we first arrange the data in ascending order.
39, 40, 40, 41, 42, 46, 48, 52, 52, 52, 54, 60, 62, 96, 98
Here,
Number of observations (n) = 15
Since the number of observations are odd, the median can be calculated as:
Median = [(n+1)/2]th observation
= [(15+1)/2]th observation
= (16/2)th observation
= 8th observation
= 52
Mode,
To find the mode, we first arrange the data in ascending order.
39, 40, 40, 41, 42, 46, 48, 52, 52, 52, 54, 60, 62, 96, 98
Here, We find that 52 occurs most frequently (3 times)
∴ Mode = 52
Question 3. The following observations have been arranged in ascending order. If the median of the data is 63, find the value of x.
29, 32, 48, 50, x, x+2, 72, 78, 84, 95
Solution:
Number of observations (n) = 10
Given that Median = 63
Since the number of observations are even, the median can be calculated as: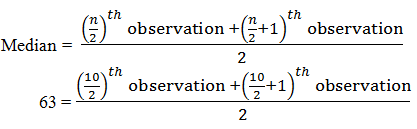
63 = [5th observation+(5+1)th observation]/2
63 = [5th observation+6th observation]/2
63 = (x+x+2)/2
63 = (2x+2)/2
x = 63-1
x = 62
Question 4. Find the mode of 14, 25, 14, 28, 18, 17, 18, 14, 23, 22, 14, 18.
Solution:
Mode,
To find the mode, we first arrange the given data in ascending order.
14,14,14,14,17,18,18,18,22,23,25,28
Here,
We find that 14 occurs most frequently (4 times)
∴ Mode = 14
Question 5. Find the mean salary of 60 workers of factory from the following table:
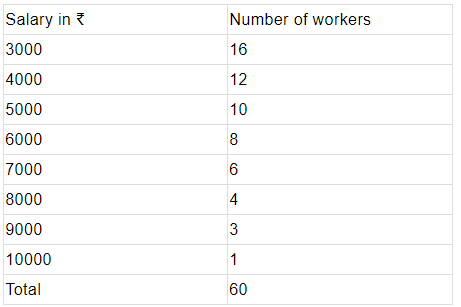
Solution:
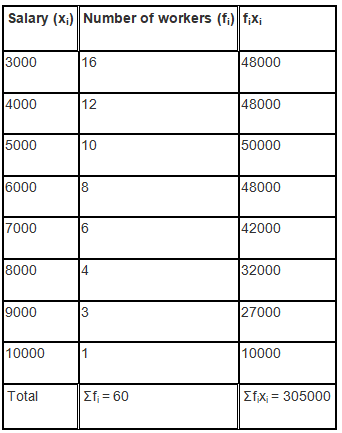
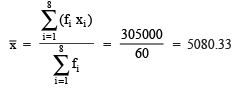
Thus, the mean salary is ₹5083.33
Question 6. Give one example of a situation in which
(i) The mean is an appropriate measure of central tendency.
(ii) The mean is not an appropriate measure of central tendency but the median is an appropriate measure of central tendency.
Solution:
(i) Mean marks obtained in the examination
(ii) Runs scored by Mahendra Singh Dhoni in 7 matches are,
39, 51, 56, 102, 83, 48, 91
Here,
Mean = (39+51+56+102+83+48+91)/7
= 470/7
= 67.1.
Median,
Arranging in ascending order we get 39, 48 51, 56, 83, 91, 102
n = 7
Median = [(n+1)/2]th observation
= ( (7+1)/2)th observation
= (8/2)th observation
= 4th observation
= 56
|
276 docs|149 tests
|
FAQs on NCERT Solutions for Class 9 Maths Chapter 14 - Exercise 14.4 Statistics
| 1. What is the importance of statistics in research? |  |
| 2. How is statistics used in business decision-making? | |
| 3. What are the different types of statistics? | |
| 4. How does statistics help in understanding social phenomena? | |
| 5. What are the limitations of statistics? | |

|
1.3K Views |

|
4.95/5 Rating |

|
Nov 16, 2024 Last updated |

|
Explore Courses for Bank Exams exam
|
|
Extra Questions
,past year papers
,NCERT Solutions for Class 9 Maths Chapter 14 - Exercise 14.4 Statistics
,Important questions
,practice quizzes
,Summary
,Previous Year Questions with Solutions
,NCERT Solutions for Class 9 Maths Chapter 14 - Exercise 14.4 Statistics
,Objective type Questions
,video lectures
,Exam
,MCQs
,mock tests for examination
,NCERT Solutions for Class 9 Maths Chapter 14 - Exercise 14.4 Statistics
,Viva Questions
,study material
,shortcuts and tricks
,Semester Notes
,ppt
,Sample Paper
,Free
;


Exercise 14.4 NCERT Solutions - Statistics Free PDF Download
Importance of Exercise 14.4 NCERT Solutions - Statistics
Exercise 14.4 NCERT Solutions - Statistics Notes
Exercise 14.4 NCERT Solutions - Statistics Bank Exams Questions
Study Exercise 14.4 NCERT Solutions - Statistics on the App
|
© EduRev
|
Education Revolution
|


Follow Us
|


within 7 days!