Bank Exams Exam  >  Bank Exams Notes  >  NCERT Mathematics for Competitive Exams  >  Exercise 14.4 NCERT Solutions - Statistics

NCERT Solutions for Class 9 Maths Chapter 14 - Exercise 14.4 Statistics

Question 1. The following number of goals were scored by a team in a series of 10 matches:
 2, 3, 4, 5, 0, 1, 3, 3, 4, 3
 Find the mean, median and mode of these scores.
 Solution: 

Mean = Average = Sum of all the observations/Total number of observations
= (2+3+4+5+0+1+3+3+4+3)/10

= 28/10

= 2.8

Median,
To find the median, we first arrange the data in ascending order.

0, 1, 2, 3, 3, 3, 3, 4, 4, 5

Here,

Number of observations (n) = 10

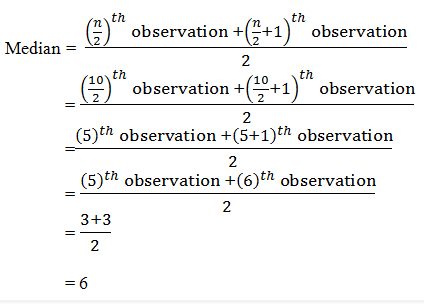
Since the number of observations are even, the median can be calculated as:
NCERT Solutions for Class 9 Maths Chapter 14 - Exercise 14.4 Statistics
= 3

Mode,

To find the mode, we first arrange the data in ascending order.

0, 1, 2, 3, 3, 3, 3, 4, 4, 5.

Here,

We find that 3 occurs most frequently (4 times)

∴ Mode = 3


Question 2. In a mathematics test given to 15 students, the following marks (out of 100) are recorded:
 41, 39, 48, 52, 46, 62, 54, 40, 96, 52, 98, 40, 42, 52, 60
 Find the mean, median and mode of this data.
 Solution: 

Mean=Average = Sum of all the observations/Total number of observations
= (41+39+48+52+46+62+54+40+96+52+98+40+42+52+60)/15
= 822/15
= 54.8
Median,
To find the median, we first arrange the data in ascending order.
39, 40, 40, 41, 42, 46, 48, 52, 52, 52, 54, 60, 62, 96, 98
Here,
Number of observations (n) = 15
Since the number of observations are odd, the median can be calculated as:
Median = [(n+1)/2]th observation
= [(15+1)/2]th observation
= (16/2)th observation
= 8th observation
= 52
Mode,
To find the mode, we first arrange the data in ascending order.
39, 40, 40, 41, 42, 46, 48, 52, 52, 52, 54, 60, 62, 96, 98
Here, We find that 52 occurs most frequently (3 times)

∴ Mode = 52


Question 3. The following observations have been arranged in ascending order. If the median of the data is 63, find the value of x.
 29, 32, 48, 50, x, x+2, 72, 78, 84, 95

Solution: 
Number of observations (n) = 10
Given that Median = 63
Since the number of observations are even, the median can be calculated as:
NCERT Solutions for Class 9 Maths Chapter 14 - Exercise 14.4 Statistics

63 = [5th observation+(5+1)th observation]/2
63 = [5th observation+6th observation]/2
63 = (x+x+2)/2
63 = (2x+2)/2
x = 63-1
x = 62


Question 4. Find the mode of 14, 25, 14, 28, 18, 17, 18, 14, 23, 22, 14, 18.
Solution:

Mode,
To find the mode, we first arrange the given data in ascending order.
14,14,14,14,17,18,18,18,22,23,25,28
Here,
We find that 14 occurs most frequently (4 times)
∴ Mode = 14


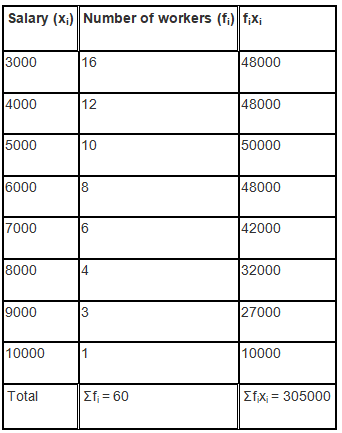
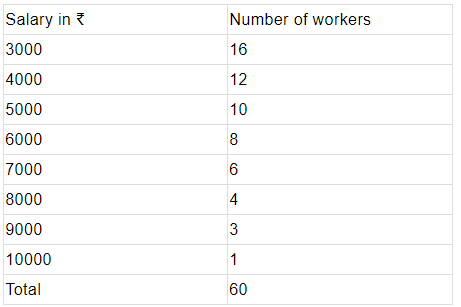
Question 5. Find the mean salary of 60 workers of factory from the following table:
NCERT Solutions for Class 9 Maths Chapter 14 - Exercise 14.4 Statistics

Solution: 

NCERT Solutions for Class 9 Maths Chapter 14 - Exercise 14.4 Statistics


NCERT Solutions for Class 9 Maths Chapter 14 - Exercise 14.4 Statistics

Thus, the mean salary is ₹5083.33


Question 6. Give one example of a situation in which
 (i) The mean is an appropriate measure of central tendency.
 (ii) The mean is not an appropriate measure of central tendency but the median is an appropriate measure of central tendency.

Solution: 

(i) Mean marks obtained in the examination

(ii) Runs scored by Mahendra Singh Dhoni in 7 matches are,
39, 51, 56, 102, 83, 48, 91
Here,
Mean = (39+51+56+102+83+48+91)/7
= 470/7
= 67.1.
Median,
Arranging in ascending order we get 39, 48 51, 56, 83, 91, 102
n = 7
Median = [(n+1)/2]th observation
= ( (7+1)/2)th observation
= (8/2)th observation
= 4th observation
= 56

The document NCERT Solutions for Class 9 Maths Chapter 14 - Exercise 14.4 Statistics is a part of the Bank Exams Course NCERT Mathematics for Competitive Exams.
All you need of Bank Exams at this link: Bank Exams
276 docs|149 tests

Top Courses for Bank Exams

FAQs on NCERT Solutions for Class 9 Maths Chapter 14 - Exercise 14.4 Statistics

1. What is the importance of statistics in research?
Ans. Statistics plays a crucial role in research as it helps in collecting, organizing, analyzing, and interpreting data. It provides researchers with tools and techniques to make sense of the data they have collected, enabling them to draw meaningful conclusions and make informed decisions based on evidence.
2. How is statistics used in business decision-making?
Ans. Statistics is extensively used in business decision-making as it helps in forecasting future trends, evaluating risks, and making informed business strategies. It enables businesses to analyze market data, customer behavior, and financial information to identify opportunities, optimize resources, and improve overall performance.
3. What are the different types of statistics?
Ans. There are two main types of statistics: descriptive statistics and inferential statistics. Descriptive statistics involve summarizing and presenting data in a meaningful way, such as through measures of central tendency (mean, median, mode) and measures of dispersion (range, standard deviation). Inferential statistics, on the other hand, involve using data from a sample to make inferences or draw conclusions about a larger population.
4. How does statistics help in understanding social phenomena?
Ans. Statistics helps in understanding social phenomena by providing a quantitative framework to analyze and interpret social data. It allows researchers to study social trends, patterns, and relationships, and make evidence-based claims about various social phenomena. Whether it is studying demographic trends, social inequality, or public opinion, statistics provides a rigorous and systematic approach to understand and analyze social issues.
5. What are the limitations of statistics?
Ans. While statistics is a powerful tool, it has certain limitations. One limitation is that it can only provide information about the observed data and cannot establish causation. It can only identify correlations and associations between variables. Additionally, statistics relies on assumptions and simplifications, which may not always reflect the complex reality of a situation. It is also important to ensure the quality and reliability of data used in statistical analysis to avoid biased or misleading results.
276 docs|149 tests
Download as PDF
Explore Courses for Bank Exams exam

Top Courses for Bank Exams

Signup for Free!
Signup to see your scores go up within 7 days! Learn & Practice with 1000+ FREE Notes, Videos & Tests.
10M+ students study on EduRev
Related Searches

past year papers

,

Viva Questions

,

shortcuts and tricks

,

study material

,

Important questions

,

MCQs

,

NCERT Solutions for Class 9 Maths Chapter 14 - Exercise 14.4 Statistics

,

NCERT Solutions for Class 9 Maths Chapter 14 - Exercise 14.4 Statistics

,

mock tests for examination

,

Semester Notes

,

ppt

,

NCERT Solutions for Class 9 Maths Chapter 14 - Exercise 14.4 Statistics

,

Sample Paper

,

Previous Year Questions with Solutions

,

Exam

,

pdf

,

Extra Questions

,

Summary

,

practice quizzes

,

Free

,

Objective type Questions

,

video lectures

;