Financial Leverage - Capital Structure, Accountancy and Financial Management | Accountancy and Financial Management - B Com PDF Download
Financial Leverage
Leverage activities with financing activities is called financial leverage. Financial leverage represents the relationship between the company’s earnings before interest and taxes (EBIT) or operating profit and the earning available to equity shareholders.
Financial leverage is defined as “the ability of a firm to use fixed financial charges to magnify the effects of changes in EBIT on the earnings per share”. It involves the use of funds obtained at a fixed cost in the hope of increasing the return to the shareholders. “The use of long-term fixed interest bearing debt and preference share capital along with share capital is called financial leverage or trading on equity”
Financial leverage may be favourable or unfavourable depends upon the use of fixed cost funds
Favourable financial leverage occurs when the company earns more on the assets purchased with the funds, then the fixed cost of their use. Hence, it is also called as positive financial leverage.
Unfavourable financial leverage occurs when the company does not earn as much as the funds cost. Hence, it is also called as negative financial leverage.
Financial leverage can be calculated with the help of the following formula:
FL = OP / PBT
Where,
FL =Financial leverage
OP = Operating profit (EBIT)
PBT = Profit before tax.
Degree of Financial Leverage
Degree of financial leverage may be defined as the percentage change in taxable profit as a result of percentage change in earning before interest and tax (EBIT). This can be calculated by the following formula
DFL= Percentage change in taxable Income / Precentage change in EBIT
Alternative Definition of Financial Leverage
According to Gitmar, “financial leverage is the ability of a firm to use fixed financial changes to magnify the effects of change in EBIT and EPS”.
FL = EBIT/EPS
Where,
FL =FinancialLeverage
EBIT =Earning Before Interest and Tax
EPS = Earning Per share.
Example 1:
A Company has the following capital structure.
| Rs. |
Equity share capital | 1,00,000 |
10% Prof. share capital | 1,00,000 |
8% Debentures | 1,25,000 |
The present EBIT is Rs. 50,000. Calculate the financial leverage assuring that the company is in 50% tax bracket.
Solution
Statement of Profit | Rs. |
Earning Before Interest and Tax (EBIT) | 50,000 |
(or) Operating Profit |
|
Interest on Debenture |
|
1,25,000 x 8 x 100 |
|
Earning before Tax (EBT) | 10,000 |
| 40,000 |
Income Tax | 20,000 |
Profit | 20,000 |

Uses of Financial Leverage
Financial leverage helps to examine the relationship between EBIT and EPS.
Financial leverage measures the percentage of change intaxable income to the percentage change in EBIT.
Financial leverage locates the correct profitable financial decision regarding capital structure of the company.
Financial leverage is one of the important devices which is used to measure the fixed cost proportion with the total capital of the company.
If the firm acquires fixed cost funds at a higher cost, then the earnings from those assets, the earning per share and return on equity capital will decrease.
The impact of financial leverage can be understood with the help of the following exercise.
Example 2:
XYZ Ltd. decides to use two financial plans and they need Rs. 50,000 for total investment.
Particulars | Plan A | Plan B |
Debenture (interest at 10%) | 40,000 | 10,000 |
Equity share (Rs. 10 each) | 10,000 | 40,000 |
Total investment needed | 50,000 | 50,000 |
Number of equity shares | 4,000 | 1,000 |
The earnings before interest and tax are assumed at Rs. 5,000, and 12,500. The tax rate is 50%. Calculate the EPS.
Solution
When EBIT is Rs. 5,000
Particulars | Plan A | Plan B |
Earnings before interest and tax (EBIT) | 5,000 | 5,000 |
Less : Interest on debt (10%) | 4,000 | 1,000 |
Earnings before tax (EBT) | 1,000 | 4,000 |
Less : Tax at 50% | 500 | 2,000 |
Earnings available to equity shareholders. | Rs.500 | Rs.2,000 |
No. of equity shares | 1,000 | 4,000 |
Earnings per share (EPS) | Rs. 0.50 | Rs. 0.50 |
Earnings/No. of equity shares |
|
|
When EBIT is Rs. 12,500
Particulars | Plan A | Plan B |
Earnings before interest and tax (EBIT). | 12,500 | 12,500 |
Less: Interest on debt (10%) | 4,000 | 1,000 |
Earning before tax (EBT) | 8,500 | 11,500 |
Less : Tax at 50% | 4,250 | 5,750 |
Earnings available to equity shareholders | 4,250 | 5,750 |
No. of equity shares | 1,000 | 4,000 |
Earning per share | 4.25 | 1.44 |
Distinguish Between Operating Leverage and Financial Leverage
Operating Leverage | Financial Leverage |
Operating leverage is associated with investment activities of the company. | Financial leverage is associated with financing activities of the company |
Operating leverage consists of fixed operating expenses of the company | Financial leverage consists of operating profit of the company. |
It represents the ability to use fixed operating cost | It represents the relationship between EBIT and EPS |
Operating leverage can be calculated by OL = C/OP | Financial leverage can be calculated by FL = OP/PBT |
A percentage change in the profits resulting from a percentage change in the sales is called as degree of operating leverage. | A percentage change in taxable profit is the result of percentage change in EBIT. |
Trading on equity is not possible while the company is operating leverage | Trading on equity is possible only when the company uses financial leverage |
Operating leverage depends upon fixed cost and variable cost. | Financial leverage depends upon the operating profits |
Tax rate and interest rate will not affect the operating leverage | Financial leverage will change due to tax rate and interest rate |
EBIT - EPS Break even chart for three different financing alternatives

Where,
DR= Debt Ratio
C1,C2,C3 = IndifferencePoint
X1, X2, X3 = Financial BEP
Financial BEP
It is the level of EBIT which covers all fixed financing costs of the company. It is the level of EBIT at which EPS is zero
Indifference
Point It is the point at which different sets of debt ratios (percentage of debt to total capital employed in the company) gives the same EPS.
Financial Leverage
When a company uses debt financing, its financial leverage increases. More capital is available to boost returns, at the cost of higher interest payments, which affect net earnings.
Financial Leverage Ratio
The financial leverage ratio is an indicator of how much debt a company is using to finance its assets. A high ratio means the firm is highly levered (using a large amount of debt to finance its assets). A low ratio indicates the opposite.
Example 1
Bob and Jim are both looking to purchase the same house that costs $500,000. Bob plans to make a 10% down payment and take a $450,000 mortgage for the rest of the payment (mortgage cost is 5% annually). Jim wants to purchase the house for $500,000 cash today. Who will realize a higher return on investment if they sell the house for $550,000 a year from today?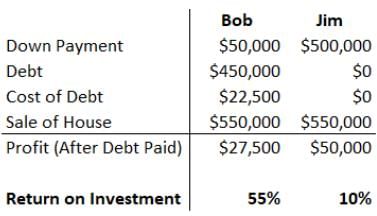
Although Jim makes a higher profit, Bob sees a much higher return on investment because he made $27,500 profit with an initial investment of $50,000 (while Jim only made $50,000 profit with a $500,000 investment).
Example 2
Using the same example above, Bob and Jim realize they can only sell the house for $400,000 after a year. Who will see a lower return on investment?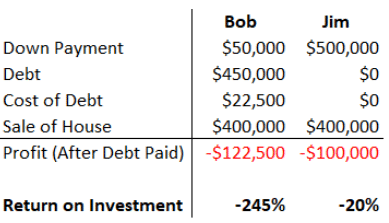
Now that the sale price of the house decreased, Bob will see a much lower return on investment (-245%) compared to Jim’s return on investment of -20%.
Example
The balance sheet of Companies XYX Inc. and XYW Inc. are as follows. Which company owns a higher ratio?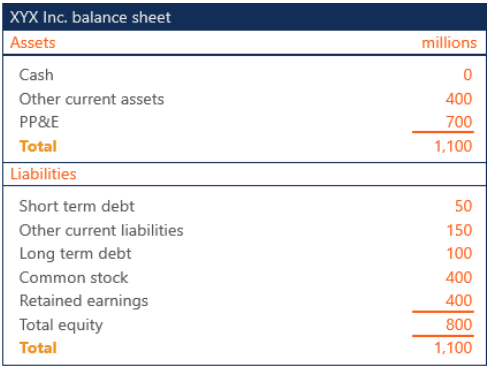
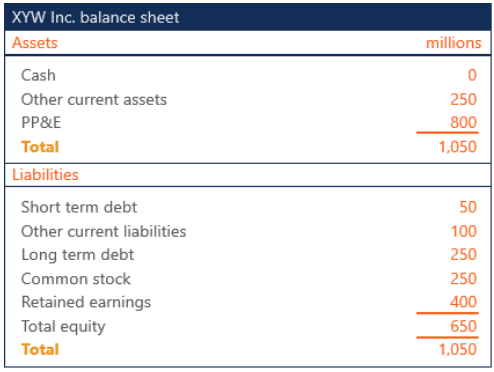
XYX Inc.
- Total Assets = 1,100
- Equity = 800
- Financial Leverage Ratio = Total Assets / Equity = 1,100 / 800 = 1.375x
XYW Inc.
- Total Assets = 1,050
- Equity = 650
- Financial Leverage Ratio = Total Assets / Equity = 1,050 / 650 = 1.615x
Company XYW Inc. reports a higher financial leverage ratio. This indicates that the company is financing a higher portion of its assets by using debt.
Operating Leverage
Fixed operating expenses gives a company operating leverage, which magnifies the upside or downside of its operating profit.
Operating Leverage Formula
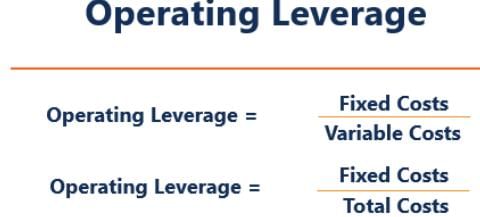
The operating leverage formula measures the proportion of fixed costs per unit of variable or total cost. When comparing different companies, the same formula should be used.
Example
The income statement of Companies XYZ and ABC are the same. Company XYZ’s operating expenses are variable, at 20% of revenue. Company ABC’s operating expenses are fixed at $20.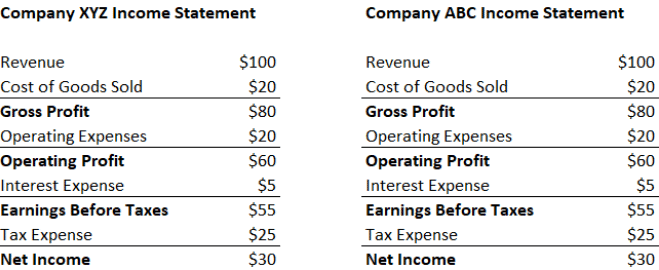
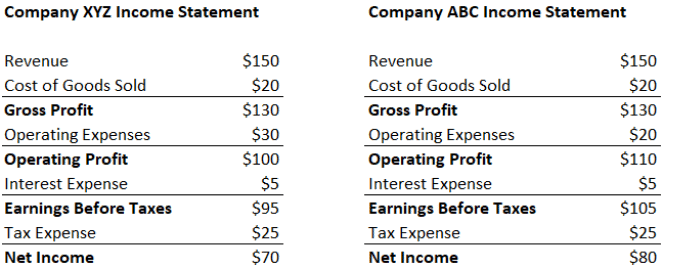
Which company will see a higher net income if revenue increases by $50?
If revenue increases by $50, Company ABC will realize a higher net income because of its operating leverage (its operating expenses are $20 while Company XYZ’s are at $30).
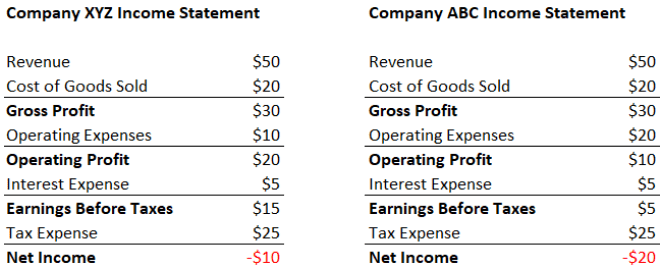
Which company will realize a lower net income if revenue decreases by $50?
When revenue decreases by $50, Company ABC loses more due to its operating leverage, which magnifies the losses (Company XYZ’s operating expenses were variable and adjusted to the lower revenue, while Company ABC’s operating expenses stayed fixed).
Example
Company A and company B both manufacture soda pop in glass bottles. Company A produced 30,000 bottles, which cost them $2 each. Company B produced 45,000 bottles at a price of $2.50 each. Company A pays $20,000 in rent, and company B pays $35,000. Both companies pay an annual rent, which is their only fixed expense. Compute the operating leverage of each company using both methods.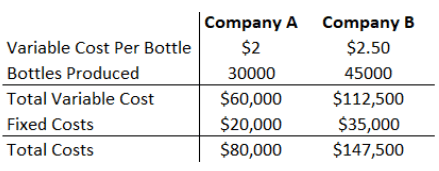
Step 1: Compute the total variable cost
- Company A: $2/bottle * 30,000 bottles = $60,000
- Company B: $2.50/bottle * 45,000 bottles = $112,500
Step 2: Find the fixed costs
In our example, the fixed costs are the rent expenses for each company.
- Company A: $20,000
- Company B: $35,000
Step 3: Compute the total costs
- Company A: Total variable cost + Total fixed cost = $60,000 + $20,000 = $80,000
- Company B: Total variable cost + Total fixed cost = $112,500 + $35,000 = $147,500
Step 4: Compute the operating leverages
Method 1:
Operating Leverage = Fixed costs / Variable costs
- Company A: $20,000 / $60,000 = 0.333x
- Company B: $35,000 / $112,500 = 0.311x
Method 2:
Operating Leverage = Fixed costs / Total costs
- Company A: $20,000 / $80,000 = 0.250x
- Company B: $35,000 / $147,500 = 0.237x
|
44 videos|75 docs|18 tests
|
FAQs on Financial Leverage - Capital Structure, Accountancy and Financial Management - Accountancy and Financial Management - B Com
| 1. What is financial leverage and how does it relate to capital structure? |  |
| 2. How can financial leverage impact a company's profitability? |  |
| 3. What are the advantages of using financial leverage? |  |
| 4. What are the risks associated with financial leverage? |  |
| 5. How can a company determine its optimal capital structure? |  |
|
44 videos|75 docs|18 tests
|

|
Explore Courses for B Com exam
|

|


