|
Tabular presentation facilitates easy understanding and interpretation of data, aids in comparison, conserves space and time, and can be transformed into diagrams and graphs. |
Card: 2 / 34 |
|
Fill in the blank: The _____ of a table provides additional information or context about the data presented. |
Card: 3 / 34 |
|
True or False: Spatial classification of data categorizes information based on time. |
Card: 5 / 34 |
|
Qualitative classification, quantitative classification, temporal classification, and spatial classification. |
Card: 8 / 34 |
|
Riddle: I can present data in rows and columns but am not a spreadsheet. What am I? |
Card: 9 / 34 |
|
A simple bar diagram is used to represent data with only one variable, classified on a temporal, quantitative, or spatial basis. 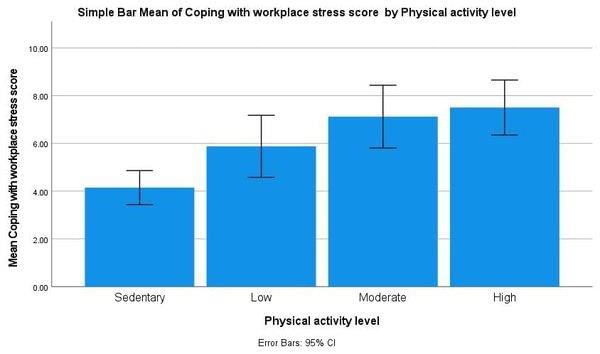 |
Card: 16 / 34 |
 Unlock all Flashcards with EduRev Infinity Plan Starting from @ ₹99 only
|
|
Different bars in a multiple bar diagram represent two or more sets of data, allowing for comparison of the relative importance of different components. |
Card: 18 / 34 |
|
A pie chart visually represents numerical proportions by dividing a circle into sectors, where each sector represents a proportionate part of the whole. 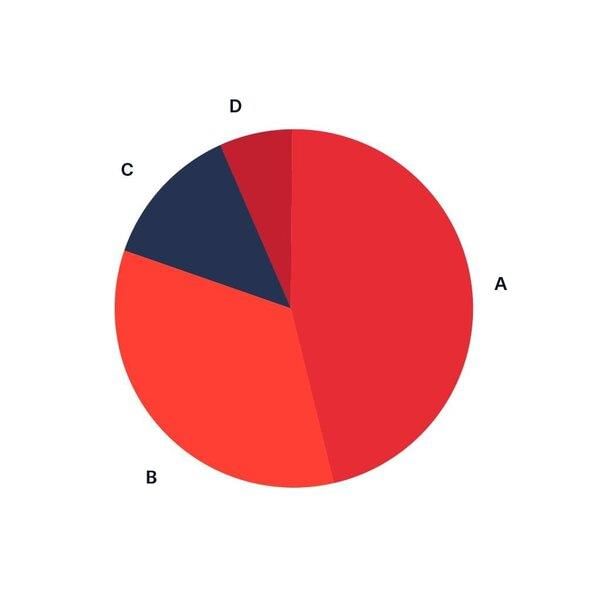 |
Card: 20 / 34 |
|
True or False: A histogram has rectangles that are not adjacent to each other. |
Card: 21 / 34 |
|
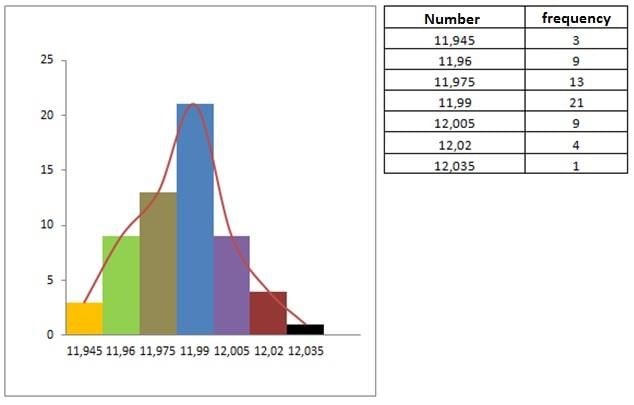
False. In a histogram, all rectangles are adjacent, with heights proportional to the corresponding frequencies. 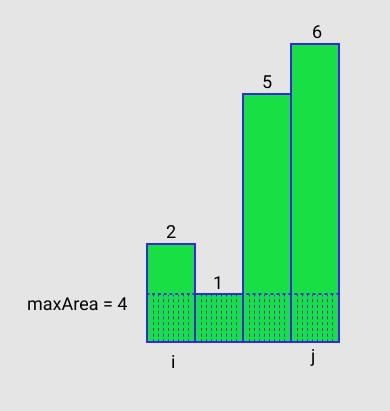 |
Card: 22 / 34 |
|
An ogive is used to display a cumulative distribution, plotting cumulative relative frequencies or cumulative frequencies against data values. 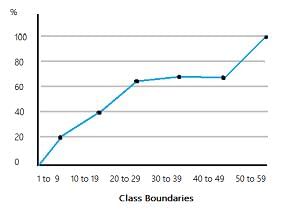 |
Card: 24 / 34 |
|
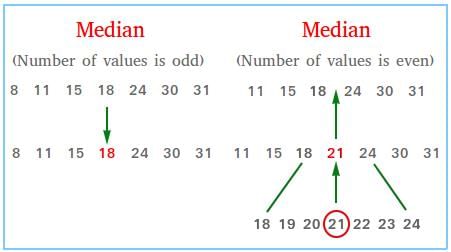
Fill in the blank: The median is the ___ value in a set of data, separating the higher half from the lower half. |
Card: 25 / 34 |
|
Riddle: I am a rectangular diagram showing frequency, where my widths are fixed but my heights vary. What am I? |
Card: 27 / 34 |
|
A frequency polygon is used to compare sets of data or display a cumulative frequency distribution using a line graph. 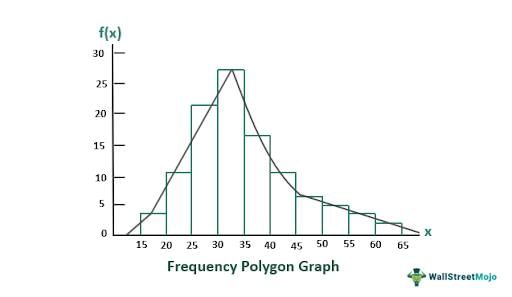 |
Card: 30 / 34 |
|
A component bar diagram shows both total values and part values of a set of data, with different parts represented in the same order for all bars. 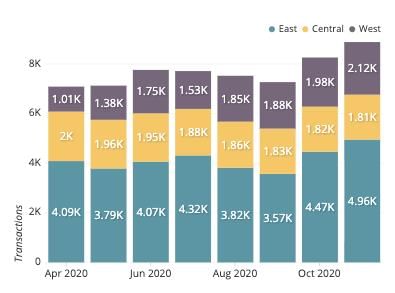 |
Card: 32 / 34 |
|
True or False: The median is always the average of the highest and lowest values in a data set. |
Card: 33 / 34 |
|
False. The median is the middlemost value in a data set, not necessarily the average of the highest and lowest values.  |
Card: 34 / 34 |


