Van Der Waal’s Equation & its Applicability | Physical Chemistry PDF Download
22. Correction for pressure
Consider a molecule A in the bulk of a vessel as shown in figure. This molecule is surrounded by other molecules in a symmetrical manner, with the result that this molecule on the whole experiences no net force of attraction.
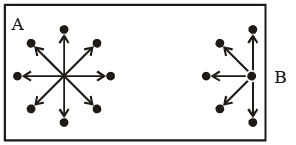
Now, consider a molecule B near the side of the vessel, which is about to strike one of its sides, thus contributing towards the total pressure of the gas. The pressure of a real gas would be smaller then the corresponding of an ideal gas, i.e.
Pi = P + correction term. ...(2)
This correction term depends upon two factors:
(i) The number of mo lecules per unit volume of the vessel. Larger this number, larger will be the net force of attraction with which the molecule B is dragged behind.

Thus, the correction term is given as
Correction term ∝ n/V ...(3a)
(ii) The number of molecules striking the side of the vessel per unit time. Larger this number, larger will be the decrease in the rate of change of momentum. Consequently, the correction term also has a larger value.
Correction term 
Taking both these factors together, we have
Correction term  or Correction term
  ...(4)
where a is the proportionality constant and is a measure of the forces of attraction between the molecules. Thus
 ...(5)
The unit of the term an2/V2 will be the same as that of the pressure. Thus, the SI unit of a Pa m6 mol–2. When the expression as given by eqs (1) and (2) are substituted in the ideal gas equation PiVi = nRT, we get
 ...(6)
This equation also applicable to real gases and is known as the van der Waals equation.
23. Applicability of Van Der Waal’ equation
At very low pressure, all the gases shown have Z » 1 and behave nearly perfectly. At high pressure, all the gases have Z > 1, signifying that they have a larger molar volume than a perfect gas. Repulsive forces are now dominant. At intermediate pressure most gases have Z < 1, indicating that the attractive forces are reducing the molar volume relative to that of a perfect gas.
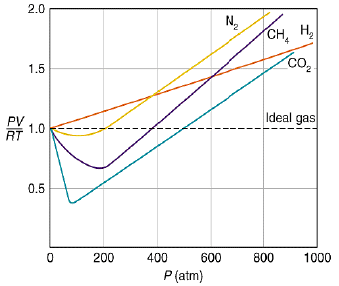
A perfect gas has Z = 1 at all pressures. Notice that although the curves approach 1 as p → 0, they do so with different slopes.
Interpretation of Deviation From Vander Walls Equation:
(i) At low pressure 
(ii) At high pressure 
(iii) At extremely low pressure 
24. Virial Equation of State
It is generalized equation of gaseous state all other equation can be written in the form of virial equation of state.
Z is expressed in power series expansion of P or 

B – Second virial coefficient
C – Third virial coefficient
D – Fourth virial coefficient
24. Reduction of Vander Wall equation in virial form
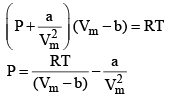
Multiplying both sides by 
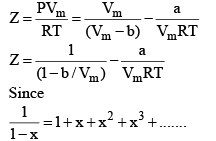
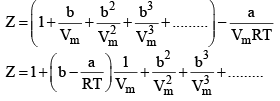
At low pressure : Vm will be larger, hence,  can be neglected
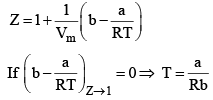
Boyle Temperature: At some intermediate temperature TB called Boyle temperature, the init ial slope is zero. This is obtained fro m equat ion by putting b - a/RTB = 0, which yields

The properties of the real gas do coincide with those of a perfect gas as p → 0.
At the Boyle temperature, the Z versus P line of an ideal gas is tangent to that of a real gas when P approaches zero. The later rises above the ideal gas line only very slowly.
In form of pressure:
Figure shows the experimental isotherms for carbon dioxide. At large molar volumes and high temperatures the real-gas isotherms do not differ greatly from perfect-gas isotherms. The small differences suggest that the perfect gas law is in fact the first term in an expression of the form.
PVm = RT(1 + B’p + C’p2 + ....)
A more convenient expansion for many applications is 
These two expressio sn are two versions o f the virial eqution of state. In each case, the term in parentheses can be identified with the compression factor, Z.
The coefficients B, C, ...., which depend on the temperature, are the second, third, ... virial coefficients.
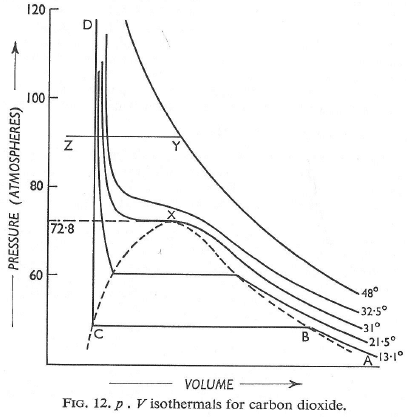
Experimental isotherms of carbon dioxide at several temperature. The ‘critical isotherm’, the isotherm at the critical temperautre, is at 31.04°C. The critical point is marked with at X. For a perect gas, dZ/DP = 0 (because Z = 1 at all pressures),
But for a real gas,

25. Critical constants
The temperature, pressure and molar volume at the critical point are called the critical temperature, Tc, critical pressure pc and critical molar volume, Vc, of the substance. Collect ively, pC, VC and Tc are the critical constants of a substance.
The single phase that fills the ent ire volume when T > Tc may be much denser than we normally consider typcial of gases and the name super-critical fluid is preferred.
Andrews isotherms: In 1869, Thomas Andrews carried out an experiment in which P – V relations o f carbon dioxide gas were measured at various temperatures. The types of isotherms obtained are shown in figure.
(1) At high temperatures, such as T4 the isotherms look like those of an ideal gas.
(2) At low temperatures, the curves have altogether different appearances.
A typical curve abcd. As the pressure increases, the volume of the gas decrease (curve a to b). At point b liquification commences and the volume decreases rapidly as the gas is converted to a liquid with a much higher density. This conversion takes place at constant pressure P. At the point c, liquification is complete and thus the line cd represents the variation of V with p of the liquid state. The steepness of the line cd is evidence of the fact that the liquid cannot be easily compressed. Thus, we note that ab represents the gaseous state, bc, liquid and vapour in equilibrium, and cd shows the liquid state only.
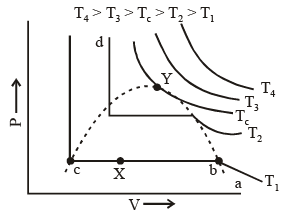
Liquification commences at b and is complete at c. At a point between b and c, say X, the ratio of liquid to gas is equal to bX/cX. The pressure corresponding to the line bc is known as vapour pressure of the liquid.
(3) At still higher temperatures we get a similar t ype of curve as discussed in (2) above, except that the width of the horizontal portion is reduced; the pressure corresponding to this portion being higher than at lower temperatures.
(4) At temperatures Tc the horizontal portion is reduced to a mere point. A temperature higher than Tc there is no indication of liquification at all.
Thus for every gas, there is a limit of temperature above which it cannot be liquefied, no matter what the pressure is
Tc or critical temp: Temperature above which a gas cannot be liquefied.
Pc or critical pressure: Minimum pressure which must be applied at crit ical temp to convert the gas into liquid.
VC or critical Volume: Volume occupied by one mole of gas at Tc & Pc
We can find the critical constant by calculating these derivatives and setting them equal to zero :
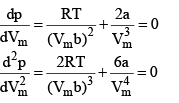
At the crit ical point, solution of these two equations are
Vc = 3b


These relations can be tested by noting that the critical compression factor, ZC, is predicted to be equal to 
30. Continuity Of State
In figure end-points of the horizontal lines have been connected with a dotted line. This portion, known as the surface of discontinuity, separates the liquid state on one side and the gas on the other. Within this curve the liquid and the gas coexist. Because of this coexistence curve, it is possible to distinguish between the two states of matter, namely, gas and liquid. However, in practice, this is not always true because it is possible to convert matter from one into another without any sharp discontinuity. This can be done as shown in figure.
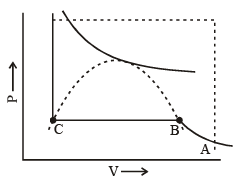
(i) Increase the temperature of the gas keeping vo lume constant. The pressure rises along AL.
(ii) Having reached L, the pressure is kept constant and the gas is cooled; this decreases the vo lume alo ng the line LD.
Thus, we have passed from A to D without the gradual change at it occur along the line BC, i..e condensation in the usual sense of the term not occur. Point D could be said to represent a highly compressed gaseous state of the substance. Whether we refer to the state in the region of point D as liqid state or as highly compressed gaseous state depend purely upon which of the two view points happens to be convenient at the moment. Thus, in the absence of the surface of discontinuity, there is no way of distinguishing between liquid and gas.
31. Reduced Equation of State
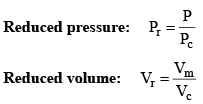
Vander Waals equation can be written in a form which does not contain any constant characteristics of individual gases. Such an equation will, therefore, be applicable to all gases. In order to obtain this equation, we define reduced pressure, reduced temperature and reduced voume as follows :

 and
and 
Thus P = Pr Pc T = Tr Tc and V = Vr Vc
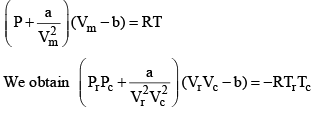

Equation (2), known as the reduced equation of state, does not contain any constant which is characteristics of a gas and is thus applicable to all gases. According to it, if the gases have the same values of reduced pressure and reduced temperature, they will have the same reduced volume. Thus, they correspond to each other. This statement is known as the law of corresponding states.
 ...(3)
According to the law of corresponding states, if two gases have the same reduced temperature and reduced pressure they will have the same reduced volume. Thus, the right hand side of Eq (3) is independent of the nature of gas and hence the value of Z is same for all gases.
Reduced Temp: Temperature in any state of gas with respect to critical temp of the gas

 Reduced equation of state
Equation is independent from a, b and R so will be followed by each and every gas independent of its nature.
|
84 videos|142 docs|67 tests
|
FAQs on Van Der Waal’s Equation & its Applicability - Physical Chemistry
| 1. What is Van Der Waal's equation and how is it derived? |  |
| 2. What are the assumptions made in Van Der Waal's equation? |  |
| 3. How is Van Der Waal's equation applicable in real-life situations? |  |
| 4. What are the limitations of Van Der Waal's equation? |  |
| 5. How does Van Der Waal's equation compare to the ideal gas law? |  |


