Grade 11 Exam > Grade 11 Notes > Chemistry for Grade 11 (IGCSE) > Graph Interpretation for Rate of a Reaction
Graph Interpretation for Rate of a Reaction | Chemistry for Grade 11 (IGCSE) PDF Download
Interpreting Data
- Data recorded during rate studies is utilized for plotting graphs to compute the rate of a reaction
- Graph plotting until the reaction's completion illustrates how the rate alters over time
- As reactants deplete, the reaction rate diminishes, leading the line to become less steep and eventually horizontal, indicating reaction completion
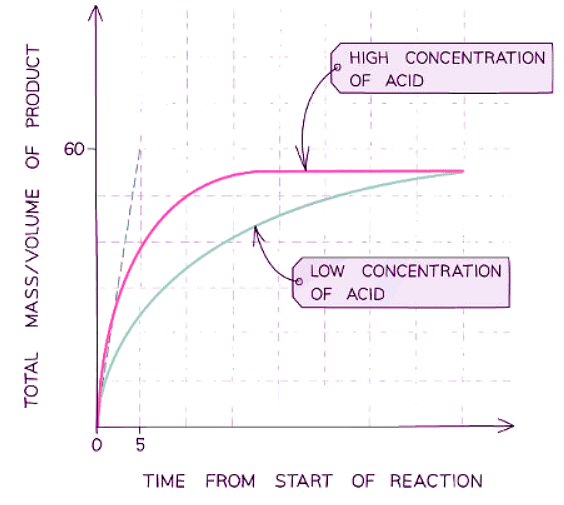
- Multiple runs of a variable can be plotted on a single graph to visualize how it affects the rate; for instance, examining how concentration impacts a reaction involving acid and marble chips
- For example, plotting the effect of concentration on a reaction between the acid and marble chips

- A steeper curve indicates a faster reaction rate, with the initial steepness indicating the quickest rate at the reaction's outset.
- As the reaction progresses, the decreasing concentration of reactants causes the rate to diminish, reflected by the curve becoming less steep.
- When a reactant is depleted, the reaction halts, the rate becomes zero, and the curve flattens into a horizontal line.
- The quantity of product produced is determined by the limiting reactant: an increase in the limiting reactant leads to a rise in product formation, while an excess reactant does not affect product quantity.
- Drawing a tangent to the slope enables the gradient to be displayed at any point on the curve, indicating the reaction rate.
- The gaseous product's volume reaches a maximum over time, causing the line to plateau, signaling the reaction's completion.
- Given the proportional relationship between volume and mass, this graph could also represent product mass versus time.
Question for Graph Interpretation for Rate of a ReactionTry yourself: What does a steeper curve on a graph plotting the rate of a reaction indicate?View Solution
The document Graph Interpretation for Rate of a Reaction | Chemistry for Grade 11 (IGCSE) is a part of the Grade 11 Course Chemistry for Grade 11 (IGCSE).
All you need of Grade 11 at this link: Grade 11
|
103 docs|53 tests
|
FAQs on Graph Interpretation for Rate of a Reaction - Chemistry for Grade 11 (IGCSE)
| 1. What factors can affect the rate of a chemical reaction? |  |
Ans. Factors that can affect the rate of a chemical reaction include temperature, concentration of reactants, surface area, presence of a catalyst, and pressure for gas-phase reactions.
| 2. How does an increase in temperature affect the rate of a reaction? |  |
Ans. An increase in temperature usually leads to an increase in the rate of a reaction as it provides more energy for the reacting particles to collide with greater force and frequency.
| 3. What role does the concentration of reactants play in determining the rate of a reaction? |  |
Ans. The higher the concentration of reactants, the more collisions will occur between particles, leading to an increased rate of reaction due to more frequent successful collisions.
| 4. How does the presence of a catalyst impact the rate of a reaction? |  |
Ans. A catalyst can increase the rate of a reaction by providing an alternative pathway with lower activation energy for the reaction to occur, allowing more particles to react successfully.
| 5. Can the rate of a reaction ever be negative? |  |
Ans. No, the rate of a reaction is always a positive value as it represents how quickly the products are formed or the reactants are used up. A negative rate would not make physical sense in the context of a chemical reaction.

|
Explore Courses for Grade 11 exam
|

|
Signup for Free!
Signup to see your scores go up within 7 days! Learn & Practice with 1000+ FREE Notes, Videos & Tests.
Related Searches


