Solved Examples: Graphics Interpretation | Data Insights for GMAT PDF Download
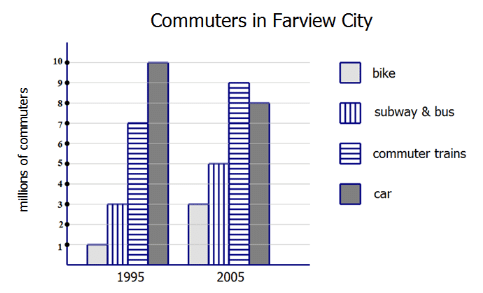
1. The graph below shows the different commuting options chosen by commuters in the Farview City metropolitan region in 1995 and in 2005.
The commuting mode whose ridership increased by approximately 29% from 1995 to 2005 is __________________.
Option:
1. bike
2. Subway & bus
3. commuter train
4. car
Ans: commuter train
Explanation: Well, we can estimate this one. A 29% increase is an increase of a little more than a quarter. Bikes tripled, so that’s way more than a quarter increase — that’s not correct.. The category “subway & bus” when from 3 to 5 million, more than a 50% — that’s not correct. Cars decreased, so that’s not correct. Even without looking at “commuter trains”, we can easily eliminate the other three. Notice “commuter trains” increased from 7 M to 9M, a 2M increase which is slightly more than one quarter of 7. That’s the answer, and we didn’t need the calculator.
2. The graph below shows the different commuting options chosen by commuters in the Farview City metropolitan region in 1995 and in 2005.
Assume the graph above shows all commuters in the two relevant years. In 2005, the car commuters were _______ percent of all commuters.
Option:
a. 25
b. 32
c. 48
d. 60
Ans: 32
Explanation: In 2005, there were 8M car commuters, and 3 + 5 + 9 + 8 = 25M commuters total. That means, car users were 8/25. Multiply this fraction by 4/4 to get 32/100 = 32%.
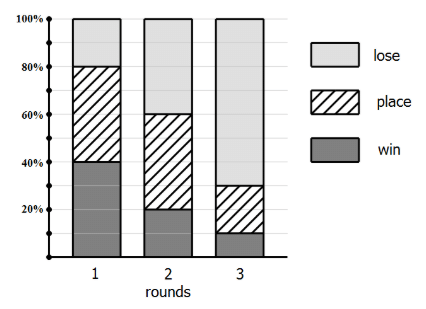
3. In a certain academic competition, there are three rounds, and three possible results in each round. The folks who “lose” acquire no commendations and do not advance to the next round. The folks who “place”, acquire a set of commendations for that round, but do not advance to the next round. The folks who “win” acquire a set of commendations for that round, and, in the case of the first two rounds, advance to the next round; in the case of the third round, the “win” means winning the entire competition. The following chart shows, on average, the percentages of participants who achieve the three results in each of the three rounds.
If 100,000 participant start this process, and if all the percentages in the chart are correct, _______ people of them would win the entire competition.
Option:
a. 800
b. 3200
c. 7000
d. 10000
Ans: 800
Explanation: Suppose 100,000 start. In the first round, 40%, or 40,000 are able to “win” and advance to the second round. In the second round, 20% of 40,000 = 8,000 are able to “win” and advance to the third round. In the third round, 10% of 8,000 = 800 win the entire competition.
4. In a certain academic competition, there are three rounds, and three possible results in each round. The folks who “lose” acquire no commendations and do not advance to the next round. The folks who “place”, acquire a set of commendations for that round, but do not advance to the next round. The folks who “win” acquire a set of commendations for that round, and, in the case of the first two rounds, advance to the next round; in the case of the third round, the “win” means winning the entire competition. The following chart shows, on average, the percentages of participants who achieve the three results in each of the three rounds.
Exactly _______ % of participants who start acquire exactly two sets of commendations.
Option:
a. 16
b. 16.8
c. 20
d. 21.6
Ans: 21.6
Explanation: How are the people who win exactly two sets of commendations? They form two groups. One group are the people who win the first round and place in the second, thus winning two commendations and not advancing. The others are the folks who win the first round, win the second round, but lose the third round, thus earning only two sets of commendations even though they advanced to the third round.
Folks who (1st = win, 2nd = place) = (0.40)*(0.40) = 0.16 = 16%
Folks who (1st = win, 2nd = win, 3rd = lose) = (0.40)*(0.20)*(0.70) = 0.056 = 5.6%
Add these: 16% + 5.6% = 21.6%
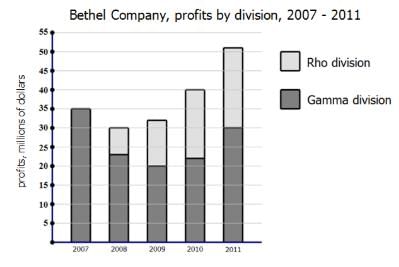
5. For years, the Bethel Company had Gamma division. The year 2008 was the first year that Rho division was in operation. The chart shows the profits generated by these two divisions. Assume these two divisions were the only source of profits for the Bethel Company during these years.
In 2010 and 2011 combined, Rho division accounted for _____ % of Bethel’s profits.
Option:
a. 28.6
b. 42.4
c. 54.1
d. 73.2
Ans: 42.4
Explanation: The numbers are spread out, so this suggests we can estimate. Profits were $40M for 2010 and $51M for 2011, for a total profit of $91M over the two years. That’s our denominator. Rho accounted for $18M in 2010 and $21M in 2011, for a total contribution of $39M — that’s our numerator. What is 39/91 as a percent? Well, 30/90 = 33%, so this has to be more than 33%, and 45/90 = 50%, so this has to be less than 50%. That immediately leaves only one possible answer, 42.4%, and we didn’t have to touch our calculator.
6. For years, the Bethel Company had Gamma division. The year 2008 was the first year that Rho division was in operation. The chart shows the profits generated by these two divisions. Assume these two divisions were the only source of profits for the Bethel Company during these years.
From 2008 to 2011, Rho division increased by ______%
Option:
a. 80
b. 150
c. 200
d. 300
Ans: 200
Explanation: From 2008 to 2011, Rho increased from $7M to $21M, a three-fold increase. Be careful, though: when something triples, that’s NOT a 300% increase. No, it started at 100% ($7M), then increased by 100% (another $7M) and then another 100% (another $7M) — a 200% increase. Tripling is always a 200% increase.
|
24 videos|28 docs|21 tests
|
FAQs on Solved Examples: Graphics Interpretation - Data Insights for GMAT
| 1. What is a graphic interpretation on the GMAT? |  |
| 2. How can I improve my skills in graphic interpretation for the GMAT? |  |
| 3. Are there any specific strategies for tackling graphic interpretation questions on the GMAT? |  |
| 4. Are there any common pitfalls to avoid when solving graphic interpretation questions on the GMAT? |  |
| 5. How can graphic interpretation skills be applied in real-life scenarios beyond the GMAT? |  |


