Grouped Frequency Distribution Table - What are Class Intervals - Statistics, Class 9, Mathematics | Extra Documents & Tests for Class 9 PDF Download
GROUPED DATA
To put the data in a more condensed form, we make groups of suitable size, and mention the frequency of each group. Such a table is called a grouped frequency distribution table.
Class-Interval : Each group into which the raw data is condensed, is called a class-interval.
Each class is bounded by two figures, which are called class limits. The figure on the left side of a class is called its lower limit and that on its right is called its upper limit.
Types of Grouped Frequency Distribution
1. Exclusive Form (or Continuous Interval Form) : A frequency distribution in which the upper limit of each class is excluded and lower limit is included, is called an exclusive form.
Ex. Suppose the marks obtained by some students in an examination are given.
We may consider the classes 0 – 10, 10 – 20 etc. In class 0 – 10, we include 0 and exclude 10. In class 10
- 20, we include 10 and exclude 20.
2. Inclusive Form (or Discontinuous Interval Form) : A frequency distribution in which each upper limit as well as lower limit is included, is called an inclusive form. Thus, we have classes of the form 0 – 10, 11 – 20, 21 – 30 etc. In 0 – 10, both 0 and 10 are included.
Ex.1 Given below are the marks obtained by 40 students in an examination :
3, 25, 48, 23, 17, 13, 11, 9, 46, 41, 37, 45, 10, 19, 39, 36, 34, 5, 17, 21, 39, 33, 28, 25, 12, 3, 8, 17, 48, 34, 15, 19, 32, 32, 19, 21, 28, 32, 20, 23.
Arrange the data in ascending order and present it as a grouped data in :
(i) Discontinuous Interval form, taking class-intervals 1 – 10, 11 – 20, etc.
(ii) Continuous Interval form, taking class-intervals 1 – 10, 10 – 20, etc.
Sol. Arranging the marks in ascending order, we get:
3, 3, 5, 8, 9, 10, 11, 12, 13, 15, 17, 17, 17, 19, 19, 19, 20, 21, 21, 23, 23, 25, 25, 28, 28, 32, 32, 32, 33, 34, 34, 36, 37, 39, 39, 41, 45, 46, 48, 48.
We may now classify them into groups as shown below:
(i) Discontinuous Interval Form (or Inclusive Form)
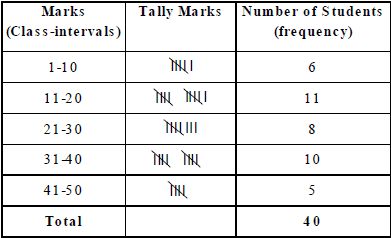
Note that the class 1 – 10 means, marks obtained from 1 to 10, including both.
(ii) Continuous Interval Form (or Exclusive Form)
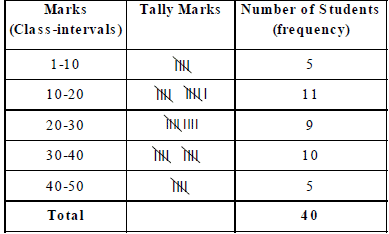
Here, the class 1 – 10 means, marks obtained from 1 to 9, i.e., excluding 10.
IMPORTANT TERMS RELATED TO GROUPED DATA
1. Class Boundaries Or True Upper And True Lower Limits :
(i) In the exclusive form, the upper and lower limits of a class are respectively known as the true upper limit and true lower limit.
(ii) In the inclusive form, the number midway between the upper limit of a class and lower limit of the subsequent class gives the true upper limit of the class and the true lower limit of the subsequent class ..
Thus, in the above table of inclusive form, we have :
true upper limit of class 1 – 10 is  = 10.5, and, true lower limit of class 11 – 20 is 10.5.
Similarly, true upper limit of class 11 – 20 is  = 20.5, and, true lower limit of class 21 – 30 is 20.5.
2. Class Size : The difference between the true upper limit and the true lower limit of a class is called its class size.
3. Class Mark of A Class =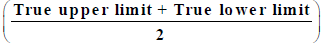
The difference between any two successive class marks gives the class size.
Ex.2 The class marks of a frequency distribution are 7, 13, 19, 25, 31, 37, 43. Find the class-size and all the class-intervals.
Sol. Class size = Difference between two successive class-marks = (13 – 7) = 6.
Let the lower limit of the first class interval be a. Then, its upper limit = (a + 6).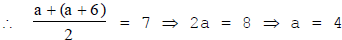
So, the first class-interval is 4 – 10.
Let the lower limit of last class-interval be b.
Then, its upper class limit = (b + 6).
So, the last class-interval is 40 – 46.
Hence, the required class-intervals are 4 – 10, 10 – 16, 16 – 22, 22 – 28, 28 – 34, 34 – 40 and 40 – 46.
METHOD OF FORMING CLASSES OF A DATA
1. Determine the maximum and minimum values of the variate occurring in the data.
2. Decide upon the number of classes to be formed.
3. Find the range, i.e., the difference between the maximum value and the minimum value. Divide the range by the number of classes to be formed to get the class-size.
4. Be sure that there must be classes having minimum and maximum values occurring in the data.
5. By counting, we obtain the frequency of each class.
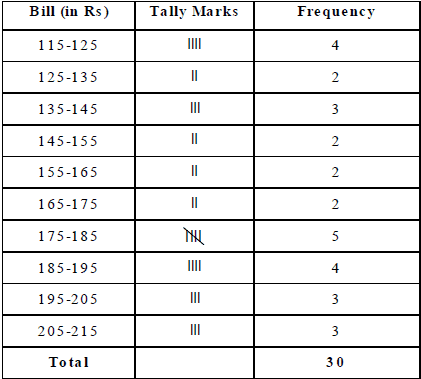
Ex.3 The water tax bills (in rupees) of 30 houses in a locality are given below :
147, 167, 136, 178, 175, 116, 155, 121, 115, 156, 176, 141, 189, 167, 177, 208, 212, 143, 203, 210, 188, 178, 212, 118, 197, 145, 134, 133, 196, 185.
Construct a frequency-distribution table with class-size 10.
Sol. Minimum observation = 115, Maximum observation = 212.
Range = (Maximum observation) – (Minimum observation) = (212 – 115) = 97.
Class size = 10.
Since  , we should have 10 classes, each of size 10. These classes are:
115 – 125, 125 – 135, 135 – 145, 145 – 155, 155 – 165, 165 – 175, 175 – 185, 185 – 195, 195– 205 and 205 – 215. The frequency distribution table may be presented as shown below :
RULE TO CONVERT DISCONTINUOUS (OR INCLUSIVE) FORM TO CONTINUOUS (OR EXCLUSIVE) FORM
In a discontinuous interval or inclusive form, we have :
Adjustment factor = (1 over 2)[(Lower limit of one class – Upper limit of previous class)]
Thus, if the classes are 1 – 10, 11 – 20, etc., then adjustment factor = (1 over 2) (11 – 10) = 0.5.
To convert data given in discontinuous form to the continuous form, we subtract the adjustment factor from each lower limit and add the adjustment factor to each upper limit to get the true limits.
Ex. 4 Convert the following frequency distribution from discontinuous to continuous form:
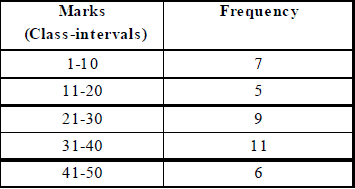
Sol. Adjustment factor = (1 over 2)(11 – 10) = 0.5. Subtract 0·5 from each lower limit and add 0·5 to each upper limit.
Then, the required table in continuous form may be prepared as under :

CUMULATIVE FREQUENCY OF A CLASS-INTERVAL
The sum of the frequencies of all the previous classes and that particular class, is called the cumulative frequency of the class.
Cumulative Frequency Table
A table which shows the cumulative frequencies over various classes is called a cumulative frequency distribution table.
Ex.5 Following are the ages (in years) of 360 patients, getting medical treatment in a hospital.
Construct the cumulative frequency table for the above data.
Sol. The cumulative frequency table for the above data is given below.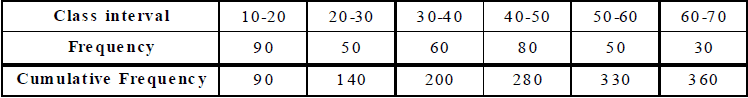
This table may be presented in 'less than form', as under.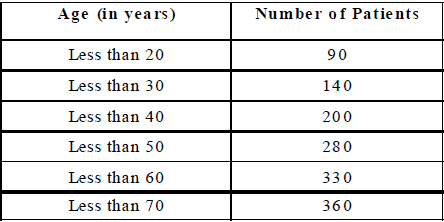
Ex.6 The monthly wages (in rupees) of 28 labourers working in a factory, are given below .-
220, 268, 258, 242, 210, 267, 272, 242, 311, 290, 300, 320, 319, 304, 302, 292, 254, 278, 318, 306, 210, 240, 280, 316, 306, 215, 256, 328.
Form a cumulative frequency table with class intervals of length 20.
Sol. We may form the table as under :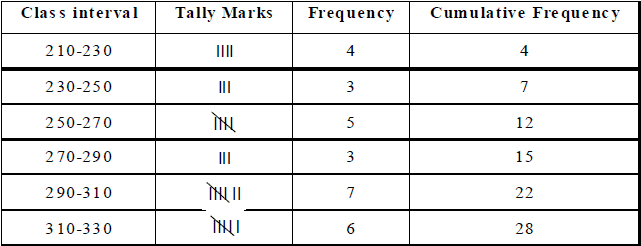
|
1 videos|228 docs|21 tests
|
FAQs on Grouped Frequency Distribution Table - What are Class Intervals - Statistics, Class 9, Mathematics - Extra Documents & Tests for Class 9
| 1. What are class intervals in a grouped frequency distribution table? |  |
| 2. What is the purpose of a grouped frequency distribution table? | |
| 3. How are class intervals determined in a grouped frequency distribution table? | |
| 4. What is the difference between a grouped frequency distribution table and a simple frequency distribution table? | |
| 5. How can a grouped frequency distribution table be used in statistical analysis? | |

|
16.7K Views |

|
4.79/5 Rating |

|
Dec 23, 2024 Last updated |

|
Explore Courses for Class 9 exam
|
|
Mathematics | Extra Documents & Tests for Class 9
,Previous Year Questions with Solutions
,Grouped Frequency Distribution Table - What are Class Intervals - Statistics
,Exam
,Mathematics | Extra Documents & Tests for Class 9
,past year papers
,mock tests for examination
,Class 9
,Grouped Frequency Distribution Table - What are Class Intervals - Statistics
,Class 9
,Extra Questions
,Class 9
,practice quizzes
,Sample Paper
,Viva Questions
,Free
,MCQs
,Objective type Questions
,video lectures
,Grouped Frequency Distribution Table - What are Class Intervals - Statistics
,study material
,Semester Notes
,Summary
,shortcuts and tricks
,ppt
,Important questions
,Mathematics | Extra Documents & Tests for Class 9
;


Grouped Frequency Distribution Table - What are Class Intervals - Statistics, Class 9, Mathematics Free PDF Download
Importance of Grouped Frequency Distribution Table - What are Class Intervals - Statistics, Class 9, Mathematics
Grouped Frequency Distribution Table - What are Class Intervals - Statistics, Class 9, Mathematics Notes
Grouped Frequency Distribution Table - What are Class Intervals - Statistics, Class 9, Mathematics Class 9 Questions
Study Grouped Frequency Distribution Table - What are Class Intervals - Statistics, Class 9, Mathematics on the App
|
© EduRev
|
Education Revolution
|


|


within 7 days!