How to attempt Bar Graph Questions in IELTS Writing Task 1 | Writing for Academic IELTS PDF Download
Introduction
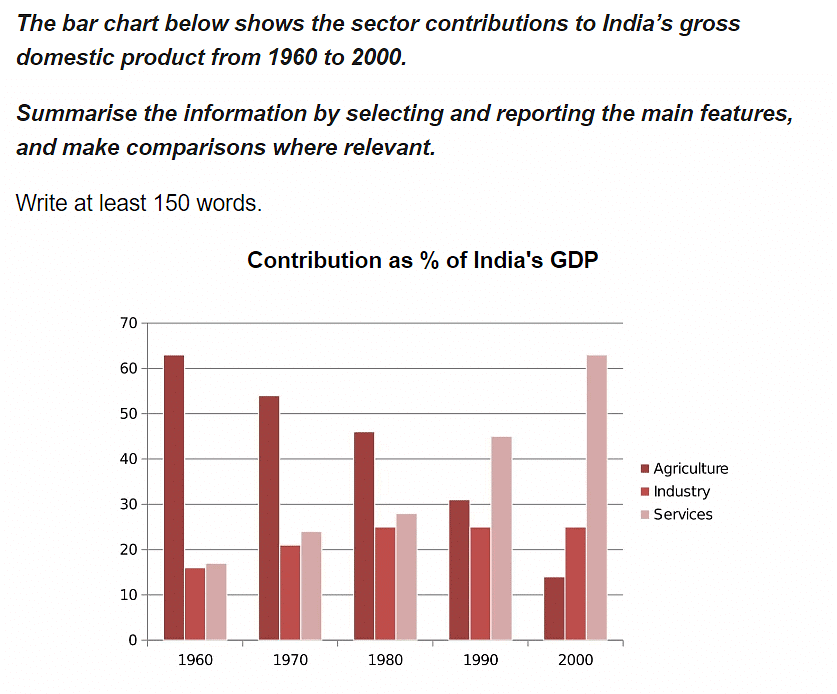
Bar graph is one of the most common questions in IELTS academic writing task 1. You will be presented with a graph and asked to describe the bar chart in IELTS. You have to complete this task in 20 mins and should write a minimum of 150 words.
Bar graph in IELTS writing assess your skills in data analysis and task achievement with grammatical accuracy and vocabulary. It is to remember, you should not evaluate or respond to a statistical bar graph, you should only interpret it and report.
What is a Bar Graph?
A Bar Graph (or Bar Chart) represents categorical data with comparison. A Bar Graph can be horizontal or vertical while plotting. In general, you find rectangular bars with lengths or heights. In simple terms, IELTS bar graph represents a diagrammatic comparison of distinct variables. A Bar Graph is different from Histogram.

How to describe a bar chart in IELTS?
In IELTS Academic Bar Graph, you need to structure your response within the time and word limits. Let us discuss some essentials that help you complete Bar Graph in IELTS Academic Writing Task 1 with a best score.
Describing a Bar chart in IELTS involves 2 steps
- To gather the data
- To interpret the data
Steps to gather data from bar graph

- The first thing to be done is to understand the data and segregate it according to the task.
- Analyze the task and data type(static data or moving date) including time scales
- What do the axes define and the units?
- Group the data
- Identify the key features
IELTS bar graph structure
Once you are ready with complete information, it is time to answer the task.
- Introduction
- Overview
- Body paragraph
- Summary
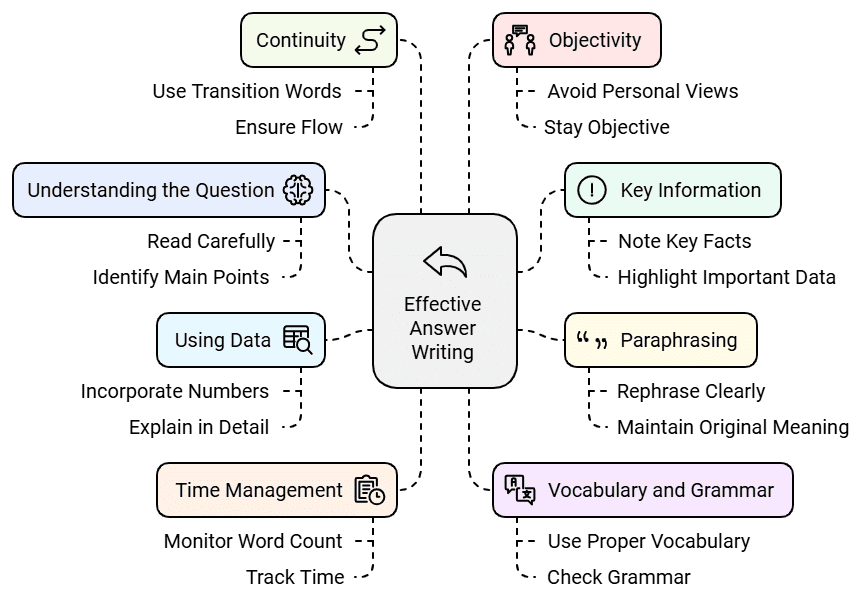
Strategies and Tips for Describing Bar Graph in IELTS Writing Task
- Read and understand the question
- Identify and note the key information
- Start with Paraphrasing the question
- Use numeric data and explain in detail
- Keep a watch on your word count and time
- Use proper vocabulary and grammar
- Maintain Continuity with Transition Words
- Don’t give your opinion

Read and Understand the Question:
- Obviously, you have a graph in front of you containing certain information. Yet, do not go straight to answer the task.
- Read the instructions carefully and understand what is asked to do.
Identify and Note the Key Information:
- After you read the requirement of the question, you ought to gather the key information for an effective task achievement.
- Collect all the numerical data and plan according to the question.
Start with Paraphrasing the question:
- Make sure that your introduction is simple and objective. Just paraphrase the information in the question. Possibly, it is only 1 sentence.
- Choose the key concepts of the graph to explain with an overview. Write about the high and low limits as well as the similarities and contrasts in the representation.
- Remember, the overview is very crucial and the graders look for this as it contributes 25% of the score.
Explain in Detail and Use Numeric Data:
- You may plan to write one body paragraph. But, the general preference is 2 body paragraphs. Here, you have to divide the information in a logical hierarchy which makes a complete sense. Organize the data with wit so that it conveys clear information.
- Important, sentences in the body paragraphs must be supported by some relevant numeric data. If you do not support your sentences with sufficient numbers, you may be awarded a bit less for the task achievement. So, don’t overlook supporting data.
Keep a watch on your word count and time:
Always, time management skills play an important role in any examination. So, keep an eye on the time limit (i.e. 20 minutes) in co-ordinance with the prescribed word count (which is minimum 150 words).
Use proper vocabulary and grammar:
- It is important to use a variety of sentence structures with a good range of vocabulary. This would boost up your lexical score. Make sure you maintain grammatical accuracy which is one more marking criteria.
- Grammar and vocabulary are 2 of 4 marking parameters that the IELTS graders consider. Complex sentences play a vital role in promoting your abilities to the grader.
- After all, the IELTS exam is a language proficiency test you must learn to structure the sentences. The sentence structures you use are definitely examined.
Maintain Continuity with Transition Words:
- You must use linking words to maintain the continuity of your sentences. Besides, linking words help the reader by giving a lead to anticipate what’s coming next in the discussion.
- Words such as in comparison with, compared to, opposing, while, whereas etc. will allow you to gain coherence and cohesion in your writing.
- Remember, linking words contribute 25% of the marks. But, make sure you use them suitably with relevance to enhance the meaning of the paragraphs.
Don’t express your opinion:
- Often, most of the candidates are confused here, the IELTS Academic Task 1 considers your task achievement and Task 2 takes your task response to assess your abilities. So, remember not to evaluate or express your opinions about the given task.
- Here, you are expected to analyse the given representation and describe it in your own words.
Follow these IELTS Academic writing tips and tricks to score good in this section.
IELTS Bar Graph Vocabulary
- To score high within the limited instructions makes the task a bit challenging. In the minimum of 150 words, you have to repeat numbers and certain words again and again. But, it creates a lack of interest in the reader.
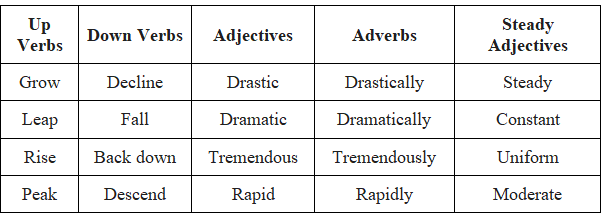
- In order to rectify this, you should be good at vocabulary. You must use a variety of words which would not only describe, but also enhance and compare the subject. Use strong words that explain your clear intention.
- IELTS bar chart vocabulary generally consists of up verbs, down verbs, adjectives and adverbs of degree and steady adjectives. Take a look over some of the example words.

|
30 videos|206 docs|17 tests
|


