Important Formula: Bar Charts | Quantitative Aptitude for SSC CGL PDF Download
Definition
A bar chart illustrates data through either horizontal or vertical bars, with the length of each bar directly proportional to the quantity it signifies.
Formulas for Bar Chart
Types of Bar Chart
There are 3 main types of bar charts:
- Vertical Bar Chart: The prevalent form of bar chart, where bars are arranged in a vertical orientation to visually depict grouped data.
- Horizontal Bar Chart: This style of bar chart features horizontally plotted bars, suitable for comparing independent data sets.
- Double Bar Chart: A visual representation of data using two parallel bars of differing heights on the same graph, whether arranged vertically or horizontally.
Properties of Bar Chart
- The spacing between bars is consistent, whether in a horizontal or vertical orientation.
- Bars maintain uniform width, and the variable quantity is indicated along one of the axes.
- The bar graph's scale delineates the manner in which numerical values are applied in the dataset. This involves a set of markings at regular intervals that facilitate the measurement of objects.
Applications of Bar Chart
- Evaluating summary statistics across categories.
- Examining various groups across different time periods.
- Illustrating the function of a variable (sum, average, standard deviation) categorized by different groups.
- Contrasting diverse categorical or discrete variables, such as age groups, classes, schools, etc.
- Presenting data in a chronological sequence.
Note: When constructing a bar chart it is important to choose a suitable scale to represent the frequency.
Examples
Example 1: The bar graph given below shows the sales of books (in thousand number) from six branches of George Orwell publishing company during two consecutive years 2000 and 2001. Sales of Books (in thousand numbers) from Six Branches – Z1, Z2, Z3, Z4, Z5 and Z6 of a publishing Company in 2000 and 2001.
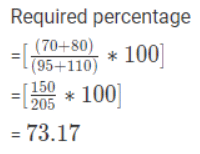
Total sales of branch Z6 for both the years is what percent of the total sales of branches Z3 for both the years?
(a) 68.54%
(b) 71.11%
(c) 73.17%
(d) 75.55%
Ans: (c)
Example 2: The bar graph given below shows the sales of books (in thousand number) from six branches of George Orwell publishing company during two consecutive years 2000 and 2001. Sales of Books (in thousand numbers) from Six Branches – Z1, Z2, Z3, Z4, Z5 and Z6 of a publishing Company in 2000 and 2001.
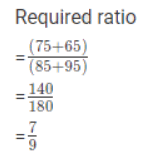
What is the ratio of the total sales of branch Z2 for both years to the total sales of branch Z4 for both years?
(a) 2 : 3
(b) 3 : 5
(c) 4 : 5
(d) 7 : 9
Ans: (d)
Example 3: The bar graph given below shows the sales of books (in thousand number) from six branches of George Orwell publishing company during two consecutive years 2000 and 2001. Sales of Books (in thousand numbers) from Six Branches – Z1, Z2, Z3, Z4, Z5 and Z6 of a publishing Company in 2000 and 2001.
What is the average sales of all the branches (in thousand numbers) for the year 2000?
(a) 73
(b) 80
(c) 83
(d) 88
Ans: (b)
Average sales of all the six branches ( in thousand numbers) for the year 2000
= 80
Example 4: The bar graph given below shows the sales of books (in thousand number) from six branches of George Orwell publishing company during two consecutive years 2000 and 2001. Sales of Books (in thousand numbers) from Six Branches – Z1, Z2, Z3, Z4, Z5 and Z6 of a publishing Company in 2000 and 2001.
Total sales of branches Z1, Z3 and Z5 together for both the years (in thousand numbers) is?
(a) 250
(b) 310
(c) 435
(d) 560
Ans: (d)
Total sales of branches Z1, Z3 and Z5 for both the years (in thousand numbers)
= (80 + 105) + (95 + 110) + (75 + 95)
= 560.
Example 5: The bar graph given below shows the sales of books (in thousand number) from six branches of George Orwell publishing company during two consecutive years 2000 and 2001. Sales of Books (in thousand numbers) from Six Branches – Z1, Z2, Z3, Z4, Z5 and Z6 of a publishing Company in 2000 and 2001.
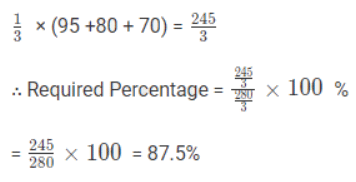
What percent of the average sales of branches Z1, Z2 and Z3 in 2001 is the average sales of branches Z1, Z3 and Z6 in 2000?
(a) 75%
(b) 77.5%
(c) 82.5%
(d) 87.5%
Ans: (d)
Average sales (in thousand number) of branches Z1, Z2 and Z3 in 2001
Average sales (in thousand number) of branches Z1, Z3 and Z6 in 2000
|
314 videos|170 docs|185 tests
|
|
314 videos|170 docs|185 tests
|


