Important Questions: Determination of Income & Employment | Economics Class 12 - Commerce PDF Download
Very Short Answer Type Questions
Q1: What is ‘Aggregate Supply’ in macroeconomics?
Ans: Aggregate Supply (AS) refers to the planned aggregate production by the producers during a period of one year. It is equal to the income generated.
Q2: What are the two main constituents of AD?
Ans:
- Consumption
- Investment
Q3: Why does consumption curve not start from the origin?
Ans: Consumption curve does not start from zero because people consume even at zero level of income.
Q4: What do you understand by APC?
Ans: Average Propensity to Consume (APC) is the ratio of total consumption (C) to total income (Y).
Q5: How is Average Propensity to Consume measured?
Ans: Average propensity to consume (APC) is measured as below:
Q6: State the relationship between MPS and MPC.
Ans: The sum of Marginal Propensity to Consume (MPC) and Marginal Propensity to Save (MPS) is always equal to one. That is,
MPC + MPS = 1
Q7: What is consumption?
Ans: Consumption refers to that part of income, which is spent by the households on the purchase of consumer goods and services.
Q8: Give the meaning of autonomous consumption.
Ans: Autonomous consumption is the amount of consumption expenditure at zero level of income. It does not change with change in income.
Short Answer Type Questions
Q9: In an economy Aggregate Demand is less than Aggregate Supply. Explain the changes that will take place in this economy.
Ans: Deficient demand refers to a situation in which Aggregate Demand in the economy is less than the Aggregate Supply (AD < AS) at full employment level. Deficient demand is also known as deflationary gap.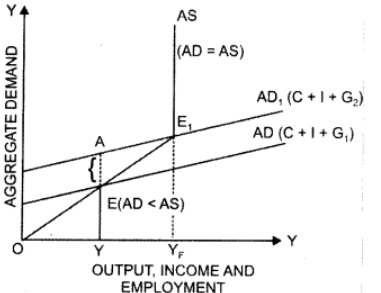
In the diagram, the initial Aggregate Demand curve is AD. Aggregate Supply (AS) is a vertical line at the full employment level of output (YF). With the initial government expenditure of G1 the Aggregate Demand is OY while Aggregate Supply is OYp. There is a situation of deficient demand of AE. As government expenditure is increased to G2, AD curve shifts up until equilibrium
Q10: Distinguish between Average Propensity to Consume and Marginal Propensity to Consume. The value of which of these two can be greater than one and when?
Ans: Average Propensity to Consume (APC) is the ratio of total consumption (C) to total income (Y).
APC = C/Y
Marginal Propensity to Consume (MPC) is the ratio of change in consumption to the change in income. It is the slope of the consumption function.
MPC= ΔC/ΔY
The value of APC can be greater than one when current consumption exceeds current income.
Q11: What are induced and autonomous investments?
Ans: Induced Investment Induced investment is the investment, which is affected by the changes in income and production in the economy. At higher level of income, the demand for goods is high and hence, the rate of profit increases. Investment automatically increases while rate of profit increases.! Autonomous Investment Autonomous investment is the investment, which is not affected by the changes in income, rate of interest or rate of profits. In other words, autonomous investment is income inelastic. Autonomous investment is increased to provide education, health, etc. facilities to increasing population.
Q12: Draw and explain an investment demand curve.
Ans: Rate of interest is an important determinant of investment. Rate of interest and investment demand are inversely related. The demand for investment decreases when the rate of interest is high. Similarly, the demand for investment increases when the rate of interest is low. This inverse relationship between the rate of interest and the level of investment is illustrated in the Investment Demand Curve shown below:
Q13: Can an economy be in a state of underemployment equilibrium? Explain with the help of a diagram.
Ans: Yes, an economy can be in a state of underemployment equilibrium. Equilibrium is attained when planned expenditure is equal to the planned output in the economy.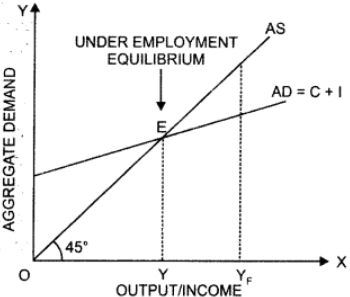
If this equality is achieved at a level less than full employment level of output then the economy will be in a situation of underemployment equilibrium.
C + I curve shows Aggregate Demand (AD) at different levels of output. OY is the underemployment level of output and OYF is the full employment level of output. The – OY level of output is sufficient to meet current Aggregate Demand. Thus, at OY level of output the economy is in equilibrium but it is a situation of underemployment equilibrium.
Long Answer Type Questions
Q14: Explain the concept of underemployment equilibrium with the help of a diagram. Show on the same diagram the additional investment expenditure required to reach full employment equilibrium.
Ans: Underemployment equilibrium is a state of equilibrium where not all resources are fully employed, that is, some resources are underemployed. The idea of underemployment equilibrium is explained in the Keynesian approach. The Keynesian approach was developed against the background of the great depression of 1930s.
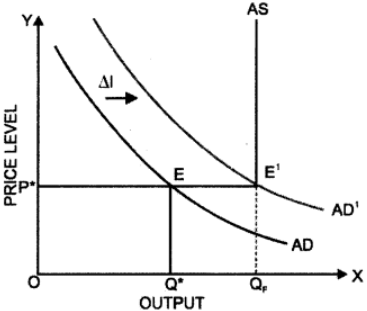
When there is deficient demand, actual Aggregate Demand is less than the full employment level of output. It is the situation of underemployment equilibrium. The concept of underemployment equilibrium can be explained with the help of following diagram:
- In this diagram, AD is the Aggregate Demand curve and AS is the Aggregate Supply curve. OP* is the equilibrium price level, OQ* is the equilibrium level of output and OQF is the full employment level of output
- Equilibrium is attained at the point of intersection of the Aggregate Demand curve and Aggregate Supply curve. It is an underemployment equilibrium because the equilibrium level of output is less than full employment level of output (OQ* < OQF).
In order to overcome the problem of underemployment equilibrium, the additional investment expenditure is required. Aggregate Demand curve will shift from AD to AD, by an amount of additional investment expenditure (∆l). The new point of intersection is E1, which is the full employment level of output. Thus, the Keynesian remedy to underemployment equilibrium places emphasis on increasing the level of Aggregate Demand by increasing investment expenditure.
Q15: Explain determination of national income using saving and investment approach. Use diagram explain the changes that take place when saving is greater than investment.
Ans: The equilibrium is determined at the level of income where Aggregate Demand is equal to the Aggregate Supply. That is,
AD = AS … (1)
We know that, AD = C +1 …(2)
AS = C + S … (3)
By substituting (2) and (3) in (1), we get;
C + I = C + S
On I = S
Thus, the equilibrium level of income and output is attained when planned saving (S) and planned investment (I) are equal. The determination of equilibrium level of income using saving investment approach can be explained with the help of a diagram. In the diagram, SS is the saving curve that shows planned saving at different levels of income. II is the investment curve that shows investment as given and constant. Planned saving and investment are equal (S = I) at point E. Corresponding to this point, OY* is the equilibrium level of income and output.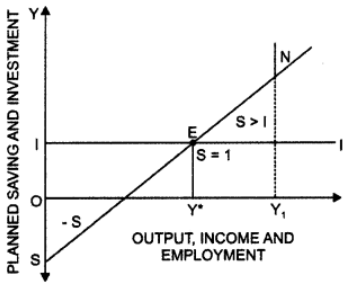
At OY, level of output, planned saving is saving is greater than planned investment (S > I). There is a situation of deficient demand in the economy. Thus, producers will increase inventory and output would contract until equilibrium is attained.
Q16: Explain monetary measures for correcting inflationary and deflationary gap.
Ans: Following are the monetary measures for correcting inflationary and deflationary gap:
- Open Market Operation: Open .mirfeet perish: is- the policy of the central monetary authority to sell and buy; The government securities in.the market. RBI purchases or sells government securities to the general public in a bid to correct deficient or excess demand in the economy.
- Bank Rate Policy: Bank rate is the minimum rate at which the central bank discounts the first class bills of exchange and provides credit to the commercial banks. Higher bank rate reduces the lending capacity of the commercial banks as they get funds at a higher interest rate from RBI.
- Consequently, credit contracts in the economy as public borrows less at high rate of interest. It reduces excess demand. Similarly, lower bank rate increases the lending capacity of the commercial banks as they get funds at a lower interest rate from RBI. Consequently, credit expands in the economy as public borrows more at low rate of interest. It solves the problem of deficient demand.
- Varying Reserve Requirements: Cash Reserve Ratio (CRR) is the minimum fraction of the total deposits with the commercial banks, which they are required to keep with the central bank Statutory Liquidity Ratio (SLR), on the other hand, is the minimum fraction of the total deposits with the commercial bank, which they are required to maintain in the form of specified liquid assets. A high (low) value of CRR or SLR helps increase (decrease) the value of reserve deposit ratio, thus diminishing (increasing) the value of the money multiplier and money supply in the economy.
- Rationing of the Credit: Rationing of the credit implies controlling the quantity in the form of loan. Here, amount of loan is determined for speculative purpose. Hence, total demand can be increased by rationing of credit. It will increase the purchasing power of people and hence, deficient demand will be corrected. Rationing of credit should be increased by central bank for correcting the excess demand or inflationary gap.
Q17: Explain the concept of inflationary gap. Explain the role of Repo Rate in reducing this gap.
Ans: Inflationary gap refers to the excess of anticipated expenditure over the available supply of output at constant prices of base period. It is also known as excess demand. It measures the gap between AD and AS at full employment level of output. Since Aggregate Demand remains more than essential demand at full employment level, there is a significant increment in monetary income. Thus, there is an over employment equilibrium. This increases the Aggregate Demand but production cannot be increased as Aggregate Supply is perfectly inelastic. The problem of excess demand can be explained with the help of a diagram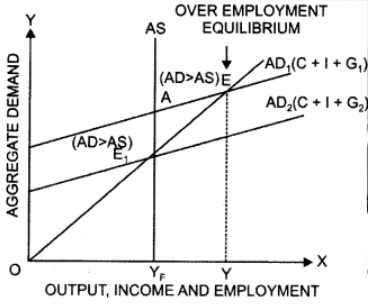
In the diagram, point E represents the state of over-employment equilibrium in the economy. At E, the gap between Aggregate Demand and Aggregate Supply is AEr That is, AE, is the excess demand. The problem of excess demand can be corrected only by the interference of the government (increasing taxes and reducing public expenditure). Repo rate refers to the rate at which central bank lends short term funds to commercial banks as the lender of last resort. The central bank increases the repo rate to correct the situation of excess demand. Higher repo rate increases the cost of borrowings by the commercial banks, which thereby reduces their lending capacity. Consequently, money supply contracts in the economy as the public borrows less at high rate of interest and hence, Aggregate Demand falls.
|
64 videos|308 docs|51 tests
|


