Introduction - Measures of Central Tendency, Business Mathematics & Statistics | SSC CGL Tier 2 - Study Material, Online Tests, Previous Year PDF Download
MEASURES OF CENTRAL TENDENCY OR AVERAGE INTRODUCTION :
A given raw statistical data can be condensed to a large extent by the methods of classification and tabulation. But this is not enough. For interpreting a given data we are to depend on some mathematical measures. Such a type of measure is the measure of Central Tendency. By the term of ‘Central Tendency of a given statistical data’ we mean that central value of the data about which the observations are concentrated . A central value which ‘enables us to comprehend in a single effort the significance of the whole is known as Statistical Average or simply average. The three common measures of Central Tendency are :
(i) Mean
(ii) Median
(iii) Mode
The most common and useful measure is the mean. As we proceed, we shall discuss the methods of computation of the various measures. In all such discussions, we need some very useful notations, which we propose to explain before proceeding any further.
(i) Index or Subscript Notation : Let X be a variable assuming n values x1 , x2 , …..x3 , We use the symbol x j (read “x sub j”) to denote any of the above mentioned n numbers. The letter j, which can stand for any of the numbers x1 , x2 , …..x n is called a subscript notation of index. Obviously, any letter other than j, as I, k, p, q and s could be used.’
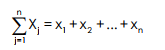
(ii) Summation Notation :
The symbol  is used to denote the sum xj ’s from j = 1 to j = n. By definition.
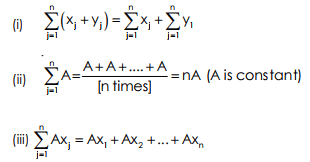
Example 1 : 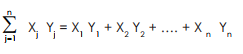
|
1365 videos|1312 docs|1010 tests
|
FAQs on Introduction - Measures of Central Tendency, Business Mathematics & Statistics - SSC CGL Tier 2 - Study Material, Online Tests, Previous Year
| 1. What are measures of central tendency in business mathematics and statistics? |  |
| 2. What are the three main measures of central tendency? | |
| 3. How is the mean calculated in business mathematics and statistics? | |
| 4. What is the median and how is it calculated? | |
| 5. When is the mode used as a measure of central tendency? | |

|
5.6K Views |

|
4.62/5 Rating |

|
Dec 22, 2024 Last updated |
|
1365 videos|1312 docs|1010 tests
|

|
Explore Courses for SSC CGL exam
|
|
Introduction - Measures of Central Tendency
,Online Tests
,Semester Notes
,Sample Paper
,Introduction - Measures of Central Tendency
,mock tests for examination
,shortcuts and tricks
,practice quizzes
,Previous Year Questions with Solutions
,Free
,Business Mathematics & Statistics | SSC CGL Tier 2 - Study Material
,study material
,Extra Questions
,Introduction - Measures of Central Tendency
,Online Tests
,Viva Questions
,Important questions
,Previous Year
,Previous Year
,video lectures
,Previous Year
,ppt
,past year papers
,Business Mathematics & Statistics | SSC CGL Tier 2 - Study Material
,Exam
,Summary
,Business Mathematics & Statistics | SSC CGL Tier 2 - Study Material
,MCQs
,Online Tests
,Objective type Questions
;


Introduction - Measures of Central Tendency, Business Mathematics & Statistics Free PDF Download
Importance of Introduction - Measures of Central Tendency, Business Mathematics & Statistics
Introduction - Measures of Central Tendency, Business Mathematics & Statistics Notes
Introduction - Measures of Central Tendency, Business Mathematics & Statistics SSC CGL Questions
Study Introduction - Measures of Central Tendency, Business Mathematics & Statistics on the App
|
© EduRev
|
Education Revolution
|


|


