Key Notes: Correlation | Economics for Grade 11 PDF Download
Correlation
It is used to identify relationships between two or more variables. Identification of relationships further helps to depict trends, and patterns in the sale of certain products, and much more.
Types of relationships
- Cause and Effect- The kinds of relationships affected by movements in quantity demanded and the price of a commodity is called cause and effect relationship.
- Temperature- Many times, the relationship is formed by the temperature. For example, Rising temperature leads to brisk sale of ice-creams. Moreover, a large number of people start going to swimming pools to beat the heat. This might have raised the number of deaths by drowning.
What does correlation measure?
Correlation studies and measures the direction and intensity of relationships among variables. Correlation measures covariation, not causation.
Types of Correlation
- Positive- The correlation is said to be positive when the variables move together in the same direction. When income rises, consumption also rises.
- Negative- The correlation is negative when they move in opposite directions. When the price of apples falls its demand increases. When the prices rise its demand decreases.
Techniques for measuring Correlation
Scatter Diagram- In this technique, the values of the two variables are plotted as points on graph paper. In a scatter diagram, the degree of closeness of the scatter points and their overall direction enables us to examine the relationship. If all the points lie on a line, the correlation is perfect and is said to be in unity. If the scatter points are widely dispersed around the line, the correlation is low. The correlation is said to be linear if the scatter points lie near a line or on a line.
Karl Pearson’s Coefficient of Correlation
This is also known as the product-moment correlation coefficient or simple correlation coefficient. Karl Pearson’s coefficient of correlation should be used only when there is a linear relation between the variables. It tells us the direction and intensity of the relation between the variables
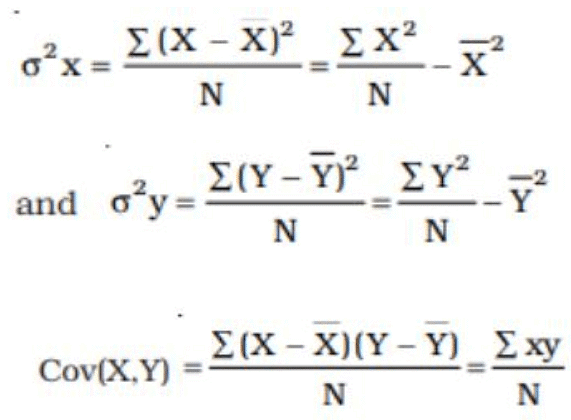
Formulas:

Properties of Correlation Coefficient (r)
- r has no unit. It is a pure number.
- A negative value of r indicates an inverse relation.
- If r is positive the two variables move in the same direction.
- The value of the correlation coefficient lies between minus one and plus one, –1 ≤ r ≤1.
- The magnitude of r is unaffected by the change of origin and change of scale.
- If r = 0 the two variables are uncorrelated
- If r = 1 or r = –1 the correlation is perfect and there is an exact linear relation.
- A high value of r indicates a strong linear relationship. Its value is said to be high when it is close to +1 or –1.
- A low value of r (close to zero) indicates a weak linear relation. But there may be a non-linear relation.
Step deviation method to calculate correlation coefficient
When the values of the variables are large, the burden of calculation can be considerably reduced by using a property of r. It is that r is independent of change in origin and scale. It is also known as the step deviation method. It involves the transformation of variables.Suppose, two variables are X and Y. If U= (X-A)/B, V=(Y-C)/D, then ruv= rxy
Spearman’s rank correlation
It is used in the following situations:
- Suppose we are trying to estimate the correlation between the heights and weights of students in a remote village where neither measuring rods nor weighing machines are In such a situation, we cannot measure height or weight, but we can certainly rank the students according to weight and height. These ranks can then be used to calculate Spearman’s rank correlation coefficient.
- Suppose we are dealing with things such as fairness, honesty, or beauty. These cannot be measured in the same way as we measure income, weight, or height. At most, these things can be measured relatively.
- Spearman’s rank correlation coefficient can be used in some cases where there is a relation whose direction is clear but which is nonlinear.
- Spearman’s correlation coefficient is not affected by extreme values.
The Spearman’s rank correlation formula is ra = 1- 6ΣD2 / n2 - n where n is the number of observations and D is the deviation of ranks assigned to a variable from those assigned to the other variable.
Calculation of Rank Correlation Coefficient
The calculation of rank correlation will be illustrated under three situations:
- The ranks are given.
- The ranks are not given. They have to be worked out from the data.
- Ranks are repeated.
|
82 videos|230 docs|49 tests
|


