Linear Functions | Mathematics for Digital SAT PDF Download
A linear function is a function that represents a straight line on the coordinate plane. For example, y = 3x - 2 represents a straight line on a coordinate plane and hence it represents a linear function. Since y can be replaced with f(x), this function can be written as f(x) = 3x - 2.
What is a Linear Function?
A linear function is of the form f(x) = mx + b where 'm' and 'b' are real numbers. Isn't it looking like the slope-intercept form of a line which is expressed as y = mx + b? Yes, this is because a linear function represents a line, i.e., its graph is a line. Here,
- 'm' is the slope of the line
- 'b' is the y-intercept of the line
- 'x' is the independent variable
- 'y' (or f(x)) is the dependent variable

A linear function is an algebraic function. This is because it involves only algebraic operations.
Linear Function Equation
The parent linear function is f(x) = x, which is a line passing through the origin. In general, a linear function equation is f(x) = mx + b and here are some examples.
- f(x) = 3x - 2
- f(x) = -5x - 0.5
- f(x) = 3
Real Life Example of Linear Function
Here are some real-life applications of the linear function.
- A movie streaming service charges a monthly fee of $4.50 and an additional fee of $0.35 for every movie downloaded. Now, the total monthly fee is represented by the linear function f(x) = 0.35x + 4.50, where x is the number of movies downloaded in a month.
- A t-shirt company charges a one-time fee of $50 and $7 per T-shirt to print logos on T-shirts. So, the total fee is expressed by the linear function f(x) = 7x + 50, where x is the number of t-shirts.
- The linear function is used to represent an objective function in linear programming problems, to help minimize the close, or maximize the profits.
How to Find a Linear Function?
We use the slope-intercept form or the point-slope form to find a linear function. The process of finding a linear function is the same as the process of finding the equation of a line and is explained with an example.
Example: Find the linear function that has two points (-1, 15) and (2, 27) on it.
Solution: The given points are (x1, y1) = (-1, 15) and (x2, y2) = (2, 27).
Step 1: Find the slope of the function using the slope formula:
m = (y2 - y1) / (x2 - x1) = (27 - 15) / (2 - (-1)) = 12/3 = 4.
Step 2: Find the equation of linear function using the point slope form.
y - y1 = m (x - x1)
y - 15 = 4 (x - (-1))
y - 15 = 4 (x + 1)
y - 15 = 4x + 4
y = 4x + 19
Therefore, the equation of the linear function is, f(x) = 4x + 19.
Identifying a Linear Function
If the information about a function is given as a graph, then it is linear if the graph is a line. If the information about the function is given in the algebraic form, then it is linear if it is of the form f(x) = mx + b. But to see whether the given data in a table format represents a linear function:
- Compute the differences in x-values.
- Compute the differences in y-values
- Check whether the ratio of the difference in y-values to the difference in x-values is always constant.
Example: Determine whether the following data from the following table represents a linear function.
Solution: We will compute the differences in x-values, differences in y values, and the ratio (difference in y)/(difference in x) every time and see whether this ratio is a constant.

Since all numbers in the last column are equal to a constant, the data in the given table represents a linear function.
Graphing a Linear Function
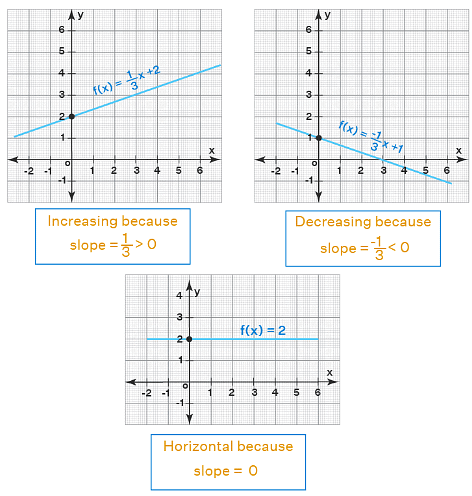
We know that to graph a line, we just need any two points on it. If we find two points, then we can just join them by a line and extend it on both sides. The graph of a linear function f(x) = mx + b is
- an increasing line when m > 0
- a decreasing line when m < 0
- a horizontal line when m = 0

There are two ways to graph a linear function.
- By finding two points on it.
- By using its slope and y-intercept.
Graphing a Linear Function by Finding Two Points
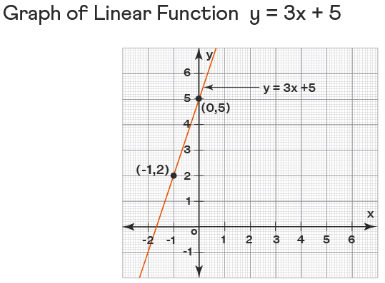
To find any two points on a linear function (line) f(x) = mx + b, we just assume some random values for 'x' and substitute these values in the function to find the corresponding values for y. The process is explained with an example where we are going to graph the function f(x) = 3x + 5.
- Step 1: Find two points on the line by taking some random values.
We will assume that x = -1 and x = 0. - Step 2: Substitute each of these values in the function to find the corresponding y-values.
Here is the table of the linear function y = 3x + 5.
Therefore, two points on the line are (-1, 2) and (0, 5). - Step 3: Plot the points on the graph and join them by a line. Also, extend the line on both sides.

Graphing a Linear Function Using Slope and y-Intercept
To graph a linear function, f(x) = mx + b, we can use its slope 'm' and the y-intercept 'b'. The process is explained again by graphing the same linear function f(x) = 3x + 5. Its slope is, m = 3 and its y-intercept is (0, b) = (0, 5).
- Step 1: Plot the y-intercept (0, b).
Here, we plot the point (0, 5). - Step 2: Write the slope as the fraction rise/run and identify the "rise" and the "run".
Here, the slope = 3 = 3/1 = rise/run.
So rise = 3 and run = 1. - Step 3: Rise the y-intercept vertically by "rise" and then run horizontally by "run". This results in a new point.
(Note that if "rise" is positive, we go up and if "rise" is negative, we go down. Also, if "run" is positive", we go right and if "run" is negative, we go left.)
Here, we go up by 3 units from the y-intercept and thereby go right by 1 unit. - Step 4: Join the points from Step 1 and Step 2 by a line and extend the line on both sides.

Graphing a Linear Function Using Slope-Intercept Form
Domain and Range of Linear Function
The domain of a linear function is the set of all real numbers, and the range of a linear function is also the set of all real numbers. The following figure shows f(x) = 2x + 3 and g(x) = 4 −x plotted on the same axes.
Note that both functions take on real values for all values of x, which means that the domain of each function is the set of all real numbers (R). Look along the x-axis to confirm this. For every value of x, we have a point on the graph.
Also, the output for each function ranges continuously from negative infinity to positive infinity, which means that the range of either function is also R. This can be confirmed by looking along the y-axis, which clearly shows that there is a point on each graph for every y-value. Thus, when the slope m ≠ 0,
- The domain of a linear function = R
- The range of a linear function = R
Note: (i) The domain and range of a linear function is R as long as the problem has not mentioned any specific domain or range.
(ii) When the slope, m = 0, then the linear function f(x) = b is a horizontal line and in this case, the domain = R and the range = {b}.
Inverse of a Linear Function
The inverse of a linear function f(x) = ax + b is represented by a function f-1(x) such that f(f-1(x)) = f-1(f(x)) = x. The process to find the inverse of a linear function is explained through an example where we are going to find the inverse of a function f(x) = 3x + 5.
- Step 1: Write y instead of f(x).
Then the above equation becomes y = 3x + 5. - Step 2: Interchange the variables x and y.
Then we get x = 3y + 5. - Step 3: Solve the above equation for y.
x - 5 = 3y
y = (x - 5)/3 - Step 4: Replace y by f-1(x) and it is the inverse function of f(x).
f-1(x) = (x - 5)/3
Note that f(x) and f-1(x) are always symmetric with respect to the line y = x. Let us plot the linear function f(x) = 3x + 5 and its inverse f-1(x) = (x - 5)/3 and see whether they are symmetric about y = x. Also, when (x, y) lies on f(x), then (y, x) lies on f-1(x). For example, in the following graph, (-1, 2) lies on f(x) whereas (2, -1) lies on f-1(x).
Piecewise Linear Function
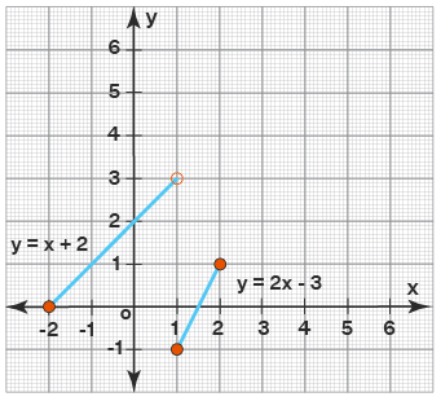
Sometimes the linear function may not be defined uniformly throughout its domain. It may be defined in two or more ways as its domain is split into two or more parts. In such cases, it is called a piecewise linear function. Here is an example.
Example: Plot the graph of the following piecewise linear function.
Solution: This piece-wise function is linear in both the indicated parts of its domain. Let us find the endpoints of the line in each case.
When x ∈ [-2, 1):
When x ∈ [1, 2]:
The corresponding graph is shown below:
Important Notes on Linear Functions
- A linear function is of the form f(x) = mx + b and hence its graph is a line.
- A linear function f(x) = mx + b is a horizontal line when its slope is 0 and in this case, it is known as a constant function.
- The domain and range of a linear function f(x) = ax + b is R (all real numbers) whereas the range of a constant function f(x) = b is {b}.
- These linear functions are useful to represent the objective function in linear programming.
- A constant function has no inverse as it is NOT a one-one function.
- Two linear functions are parallel if their slopes are equal.
- Two linear functions are perpendicular if the product of their slopes is -1.
- A vertical line is NOT a linear function as it fails the vertical line test.
|
185 videos|124 docs|75 tests
|

|
Explore Courses for SAT exam
|

|


