Q.1. How is equilibrium price of a commodity determined? Explain with the help of a demand and supply schedule.
Ans. Equilibrium price is the price at which the quantity demanded is equal to the quantity supplied. It is obtained at the point of intersection of demand and supply curves.
Determination of Equilibrium Price:
Equilibrium price is determined by powers of market demand and market supply. Market demand curve is the sum of individual demand curves and market supply is the sum of individual supply curves of producers. We can draw market demand curve by market demand schedule and market supply curve by market supply schedule. This equilibrium price is determined where market demand and market supply are equal. We can show this by following table.

In the table, when the price of the good is very less, i.e., ' I per unit then its demand is very high (100 units). However, no seller is ready to sell on this price and hence, supply is zero. Excess demand creates competition among the buyers and pushes the price up. When price is ' 5 per unit, the quantity demanded is 60 units while quantity supplied is 40 units. Again, there is excess demand by 20 units. Price would continue to increase. When price is ' 8 per unit, the quantity demanded is equal to the quantity supplied at 50 units.
Similarly, when the price of the good is ' 20 per unit then its supply is very high (100 units). However, no buyer is ready to buy on this price and hence, demand is zero. Excess supply creates competition among the sellers and pulls the price down. When price is ' 10 per unit, the quantity supplied is 60 units while quantity demanded is 30 units. Again, there is excess supply by 30 units. Price would continue to fall. Thus, the Equilibrium Price is ' 8.
Q.2. X and Y are complementary goods. Explain the sequence of effects of a fall in the price of X on the equilibrium price and quantity of Y.
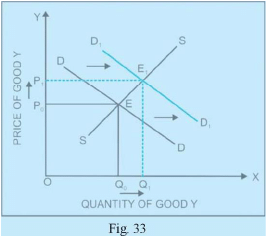
Ans. Complements are those goods which are always consumed together to satisfy a particular need or ant. Here, X and Y are complementary goods. Thus, a fall in the price of X leads to a rise in the demand for Y. The impact of fall in the pnce of X on the equilibnum price and quantity exchanged of Y can be explained with the help of a diagram.
In the diagram, the point of initial equilibrium is E where the demand curve DD and supply curve SS intersect each other. At this point, the equilibrium price of good Y is OP0 and the equilibrium quantity exchanged is OQ0. A fall in the price of good X causes the demand curve for good Y to shift rightwards from DD to D, D,. Consequently, the equilibrium price of good Y increases from OP 0 to OP and the equilibrium quantity exchanged increases from OQ0 to OQ!. The new point of equilibrium is Er.

Q.3. Market of a commodity is in equilibrium. Demand for the commodity ‘increases’. Explain the chain of effects of the change till the market again reaches equilibrium. Use diagram.
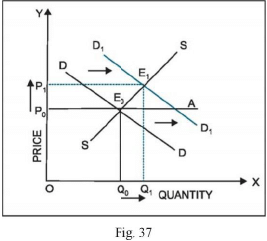
Ans. The main causes of an increase in demand curve include increase in the prices of substitute goods, decrease in the prices of complementary goods, increase in income and positive changes in hobbies. An increase in the demand or a rightward shift in the demand curve leads to the situation of excess demand at the given price. Excess demand creates competition among the buyers and pushes price up. Thus, an increase in demand increases both the equilibrium price and the equilibrium quantity.

In the diagram, when the demand curve shifts rightwards from DD to D^, excess demand is created (EQA) at price OP0. Since there is competition among the buyers due to shortage of good, the price will increase. Increase in price decreases the quantity demanded (from A to E) and increases the quantity supplied (from E0 to E).These changes continue till price rises to OPr OP, is the new equilibrium price and OQ is the new equilibrium quantity.
Q.4. Market for a commodity is in equilibrium. Demand for the commodity ‘decreases’. Explain the chain of effects of this change till the market again reaches equilibrium. Also compare prices at old and new equilibrium.
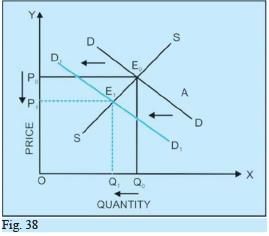
Ans. The main causes of a decrease in demand curve include decrease in the prices of substitute goods, increase in the prices of complementary goods, decrease in income and negative changes in hobbies. A decrease in the demand or a leftward shift in the demand curve leads to the situation of excess supply at the given price. Since the firms are not able to sell what they produce, excess supply creates competition among the sellers and pulls price down. Thus, a decrease in demand decreases both the equilibrium price and the equilibrium quantity.

In the diagram, when the demand curve shifts leftwards from DD to D ( D, excess supply is created (AE0) at price OP . Since there is competition among the sellers due to excess stock, the price will decrease. Decrease in price increases the quantity demanded (from A to E ) and decreases the quantity supplied (from E0 to E^These changes continue till price rises to OP . OP is the new equilibrium price and OQ is the new equilibrium quantity.
Q.5. Market for a commodity is in equilibrium. Demand for the commodity ‘increases’. Explain the chain of effects of this change till the market again reaches equilibrium. Also compare prices at old and new equilibrium.
Ans. Market for a good is in equilibrium only when the demand for the good is equal to the supply of the good. The main causes of an increase in demand include increase in the prices of substitute goods, decrease in the prices of complementary goods, increase in income and positive changes in hobbies. The chain of effects of an increase in demand can be explained with the help of the following numerical example:

In the table above, the market is in equilibrium at price of ' 5. At this price quantity demanded is equal to the quantity supplied at 50 units. Suppose at the price of ' 5, demand increases from 50 to 80 units (say, due to increase in consumers’ income), while supply remains the same at 50 units. This gives rise to an excess demand of 30 units (80 - 50). Excess demand creates competition among the buyers and pushes the price up. The price, therefore, increases from ' 5 to ' 6. A rise in price induces the buyers to buy less, and thus, decreases the quantity demanded from 80 to 75 units. Also, a rise in price induces the sellers to sell more, and thus, increases the quantity supplied from 50 to 60 units. These changes continue till price rises to ' 7, where quantity demanded is again equal to the quantity supplied at 70 units. Thus, the new equilibrium price and quantity are ' 7 and 70 units respectively. Both equilibrium price and equilibrium quantity have increased.
Q.6. Market for a good is in equilibrium. The supply of good ‘decreases’. Explain the chain of effects of this change.
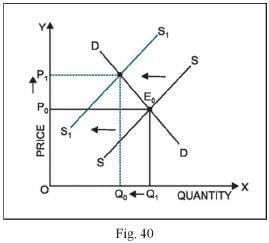
Ans. The main causes of a decrease in supply include rise in input prices, technological degradation, government policy (taxes), etc. The chain of effects of a decrease in supply can be explained with the help of the following figure:

Decrease in supply implies that less quantity is being supplied at the given price. The supply curve will shift to the left from SS to SS . This creates excess demand (EA) at price OP . Excess demand creates competition among the buyers and pushes price up. Rise in price decreases the quantity demanded (from E to E ) and increases the quantity supplied (from A to E ).These changes continue till price rises to OP . OP is the new equilibrium price and OQ is the new equilibrium quantity.


